Numerical solutions of the SEIR equations (describing the spreading of an epidemic disease) – or variations thereof –
$\dot{S} = - N$
$\dot{E} = + N - E/\lambda$
$\dot{I} = + E/\lambda - I/\delta$
$\dot{R} = + I/\delta$
with
$N = \beta I S / M$ = number of newly infected individuals
$\beta = $ infection rate
$\lambda = $ latency period
$\delta = $ duration of infectiosity
$M = S + E + I + R = $ size of the population
yield characteristic and almost symmetric peaks for the function $I(t)$ of numbers of infectious individuals. So $I(t)$ can – by a rough guess – be approximated by a Gauss curve
$$\widetilde{I}(t) = I_0\ \operatorname{exp}\Big({-\big((t-t_0)/\sigma\big)^2}\Big)$$
with $I_0$ the maximal value of $I(t)$, $I(t_0) = I_0$, and $\sigma$ such that $\widetilde{I}(0) = I(0) = 1$, i.e.
$$\sigma = t_0\ /\ \sqrt{\text{ln} I_0}$$
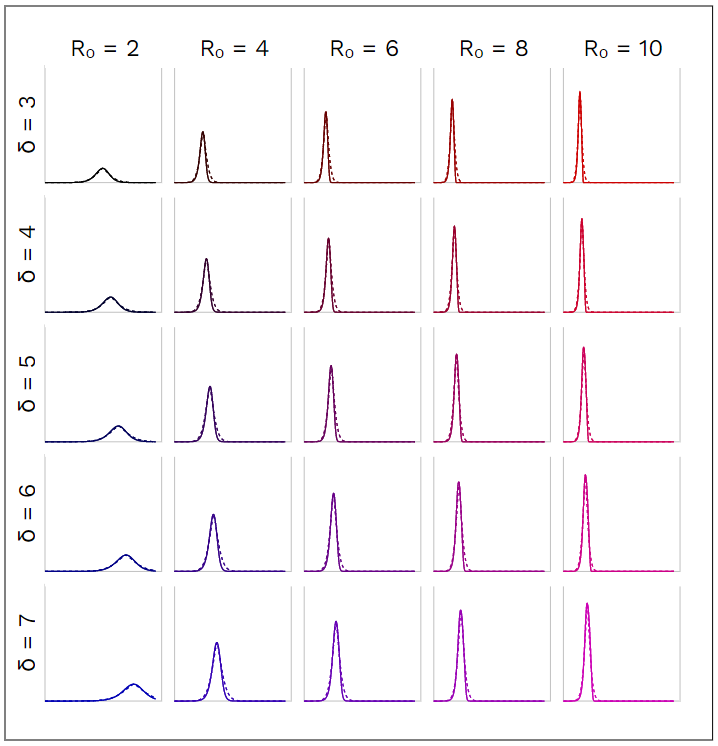
For different values of $\delta$, the reproduction number $R_0 = \beta\cdot\delta$, and a fixed value $\lambda = 2$ we find:
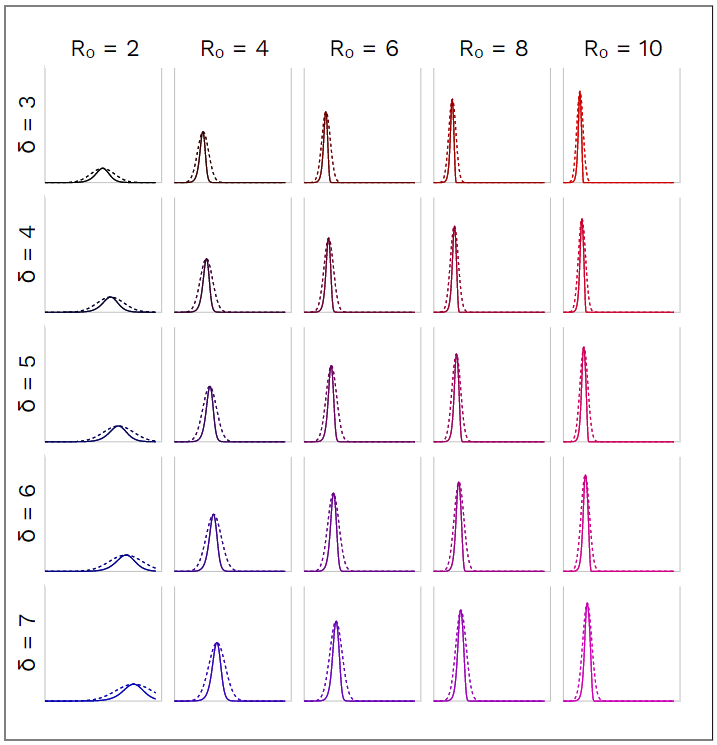
It turns out that an exponent $\sqrt{2}$ instead of $2$ yields better results, i.e.
$$\widetilde{I}(t) = I_0\ \operatorname{exp}\Big({-\big(|t-t_0|/\sigma\big)^{\sqrt{2}}}\Big)$$
My question is fourfold:
Why is a Gauss-like curve a good approximation at all? That means: Why is $I(t)$ so symmetric?
By which considerations could one come up with the exponent $\approx \sqrt{2}$?
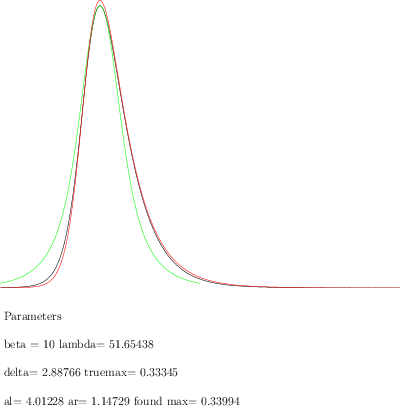
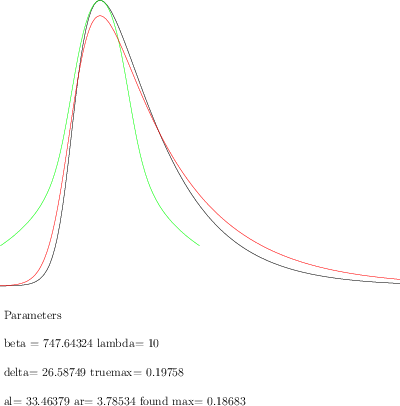
By which considerations can the asymmetry of the numerical solution $I(t)$ be understood which becomes apparent when comparing it with the symmetric approximation $\tilde{I}(t)$?
Has anyone an idea how $I_0$ and $t_0$ look like as functions of $\beta,\lambda,\delta,M$?
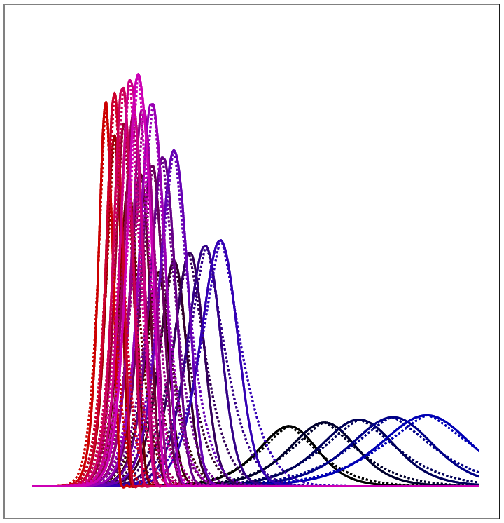
Just to give another view on the tables above, find here all curves overlayed:

