Let $L(s)$ be the $L$-function associated to the (only) classical modular form of weight $26$ and level $1$.
The completed L-function $\Lambda(s)=2(2\pi)^{-s}\Gamma(s) L(s)$ is symmetric with respect to $s \rightarrow 26-s$, so the critical line of $L$ is $\text{Re}(s)=13$.
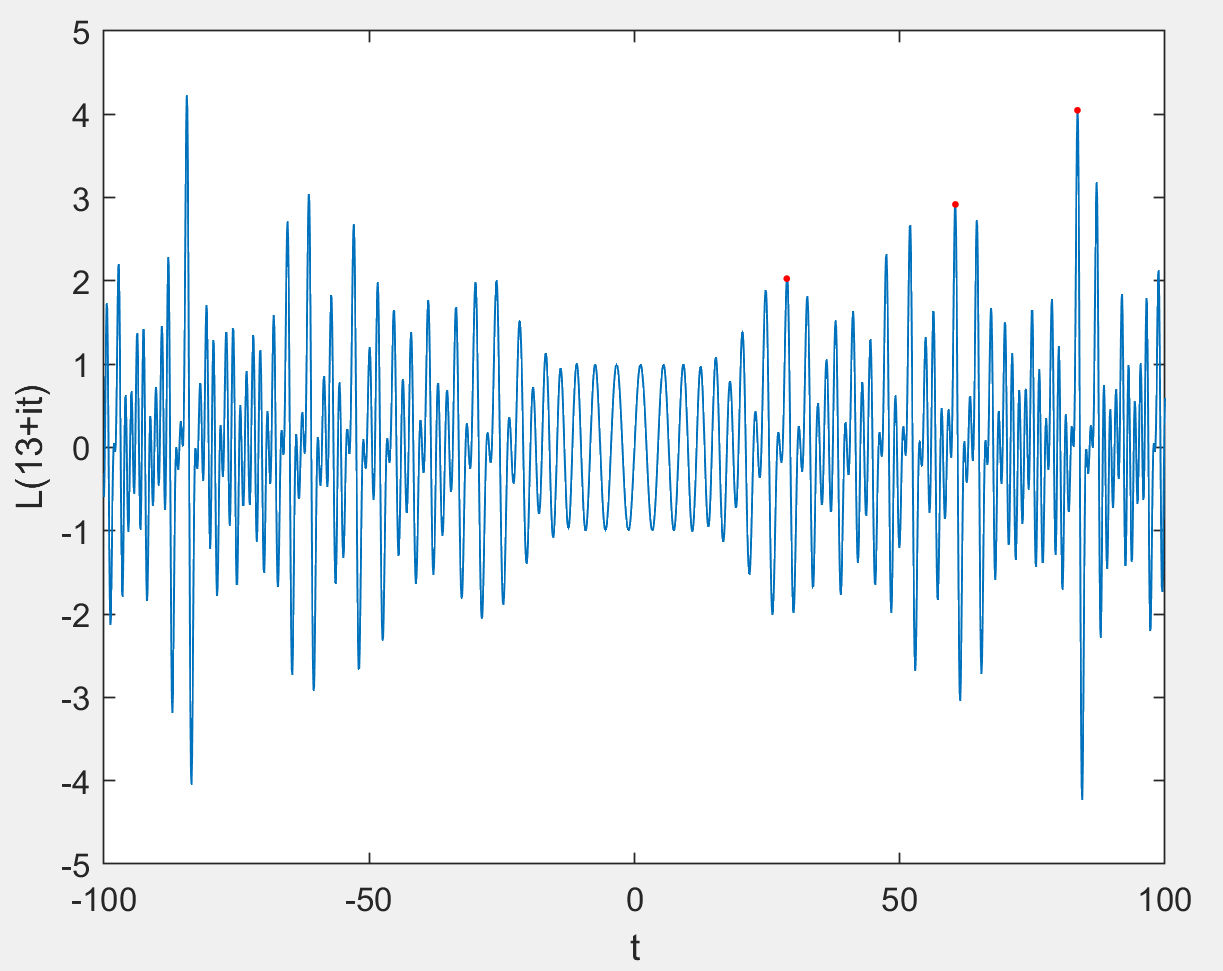
Here is a plot of the imaginary part of $L$ on the critical line, i.e. the function $f(t)= \text{Im}(L(13+it))$:
Question: How to explain these patterns:
The function near $0$ is very close to a wave with constant amplitude and slowly increasing frequency, and
There are local maxima with $t$ near $28.7$, $60.5$ and $83.5$ with values $2.027$, $2.918$ and $4.048$ respectively. The $t$s are nearly in an arithmetic progression, and the values are very close to $2$, $3$ and $4$. (One may suspect that the "correct" abscissa of second $t$ should be smaller and the respective $L(13+it)$ larger due to the "destructive interference" of oscillating functions at the correct $t$.)
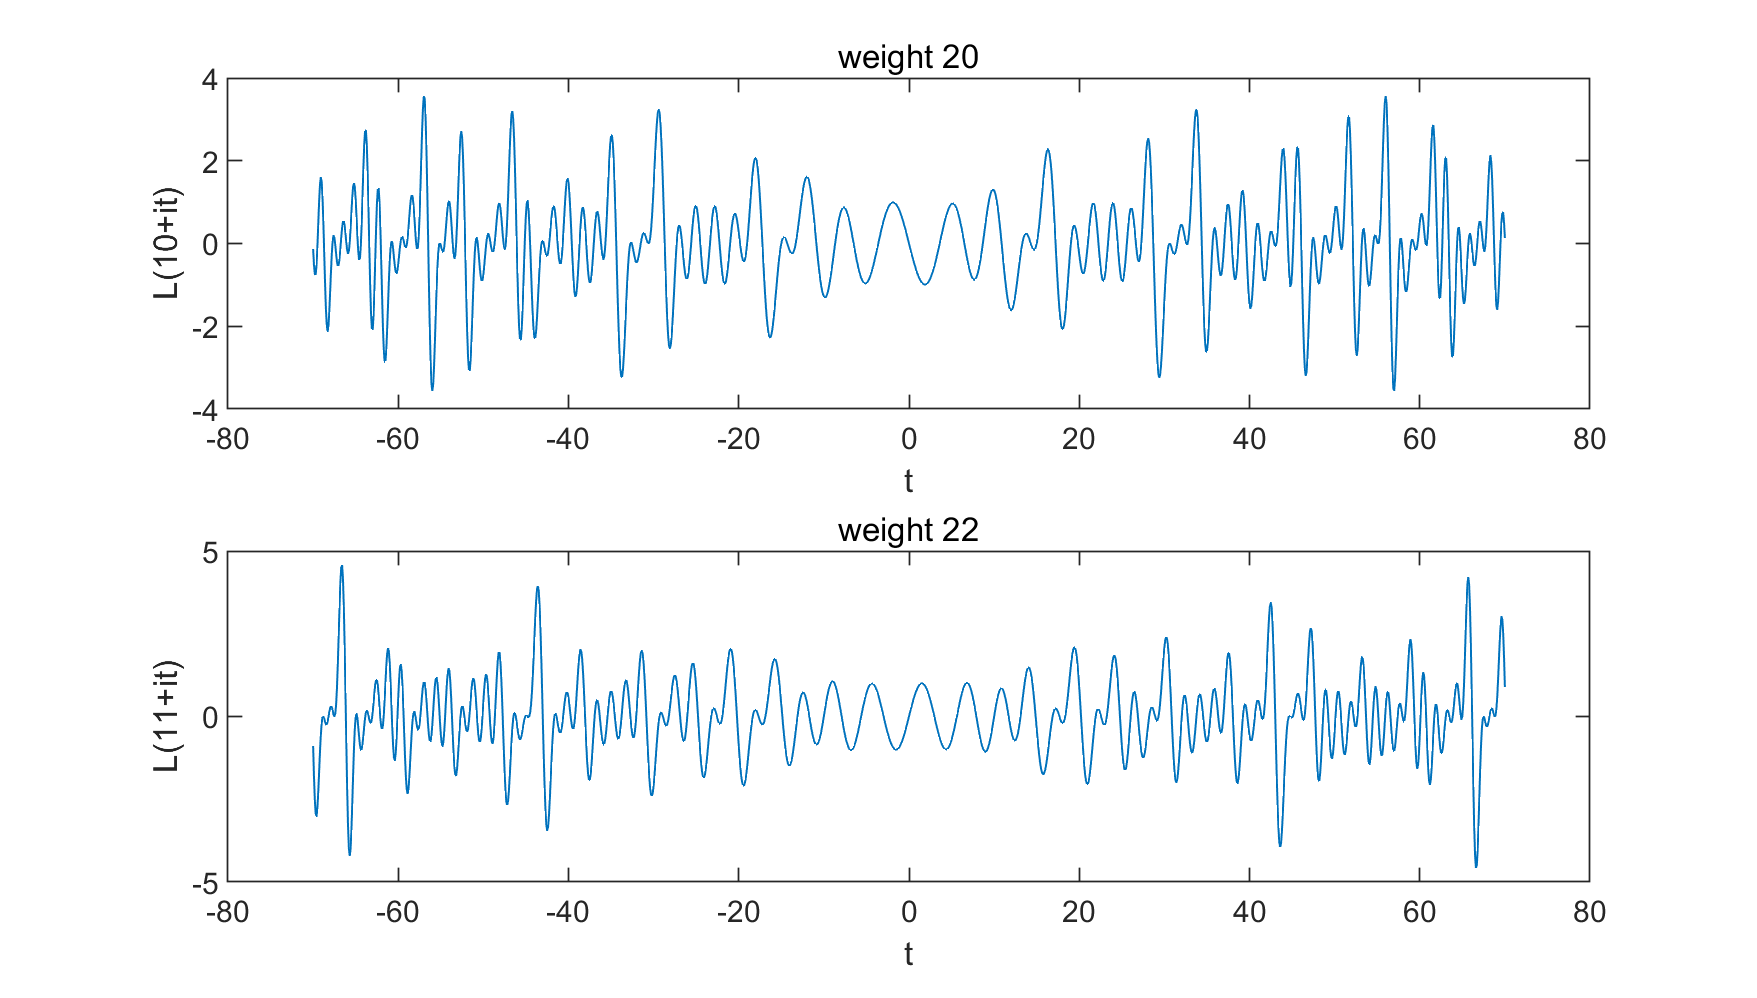
EDIT: The first pattern is also evident after replacing the weight $26$ by $22$ and $20$, though the frequency is lower.


