Given $n$ distinct points $\mathbf{x} = (\mathbf{x}_1, \ldots, \mathbf{x}_n)$ in the plane $\mathbb{R}^2$, I associate a real analytic map:
$f_{\mathbf{x}}: S^1 \to \mathbb{R}^2$
with the following properties. If $C_n(\mathbb{R^2})$ is the configuration space of $n$ distinct points in $\mathbb{R}^2$, then each there is a real analytic map $$f: C_n(\mathbb{R}^2) \times S^1 \to \mathbb{R}^2$$ such that $f_{\mathbf{x}}(-) = f(\mathbf{x},-).$$
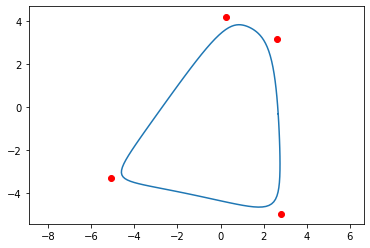
The image of $f_{\mathbf{x}}$ is in the convex hull of $\mathbf{x}$. Also, if $\mathbf{x}'$ is a permutation of the points in $\mathbf{x}$, then $f_{\mathbf{x}'} = f_{\mathbf{x}}$. Finally, if you apply a Euclidean transformation to the configuration $\mathbf{x}$, then the image of the curve $f_{\mathbf{x}}$ gets transformed by the same Euclidean transformation. Here are some plots.
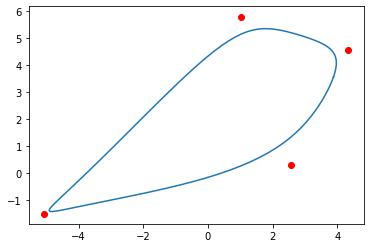
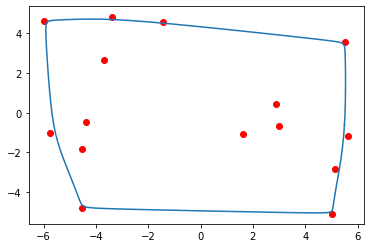
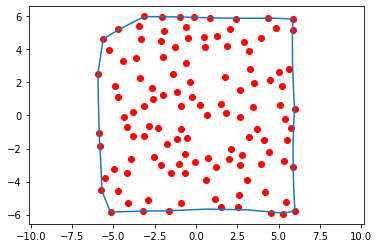 The points in $\mathbf{x}$ are shown in red, and the corresponding curve is shown in blue.
My question is, is there any interest in such Bezier-like curves? Can I publish them somewhere? I am not familiar with the area. Could someone possibly suggest some journal(s) by any chance?
Actually, I found originally a related family, where given $n$ distinct points $\mathbf{x} = (\mathbf{x}_1,\ldots,\mathbf{x}_n)$ in $\mathbb{R}^3$, I associate a real analytic map:
$$f_{\mathbf{x}}: S^2 \to \mathbb{R}^3,$$
with similar properties as the first family of maps. My work does not extend further to higher dimension though. Any comments and/or suggestions are welcome.
Edit 1: after discussing with @DanieleTampieri, and looking at the third figure, it does seems like my maps could possibly be used in boundary detection problems possibly. It is interesting that a single formula seems to accomplish what is usually done algorithmically.
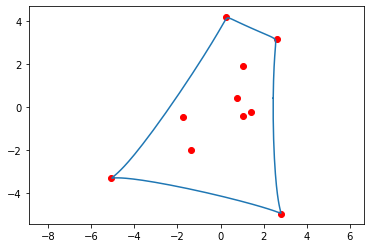
Edit 2: following one of @JochenGlueck's comments, I did the following experiment. I started with a configuration of $4$ points and plotted the corresponding curve. Then I added $6$ points at random inside the convex hull of the initial $4$ points, and plotted the corresponding curve. The new curve looks like it passes through the original $4$ points now, interestingly. Here are the corresponding two plots.
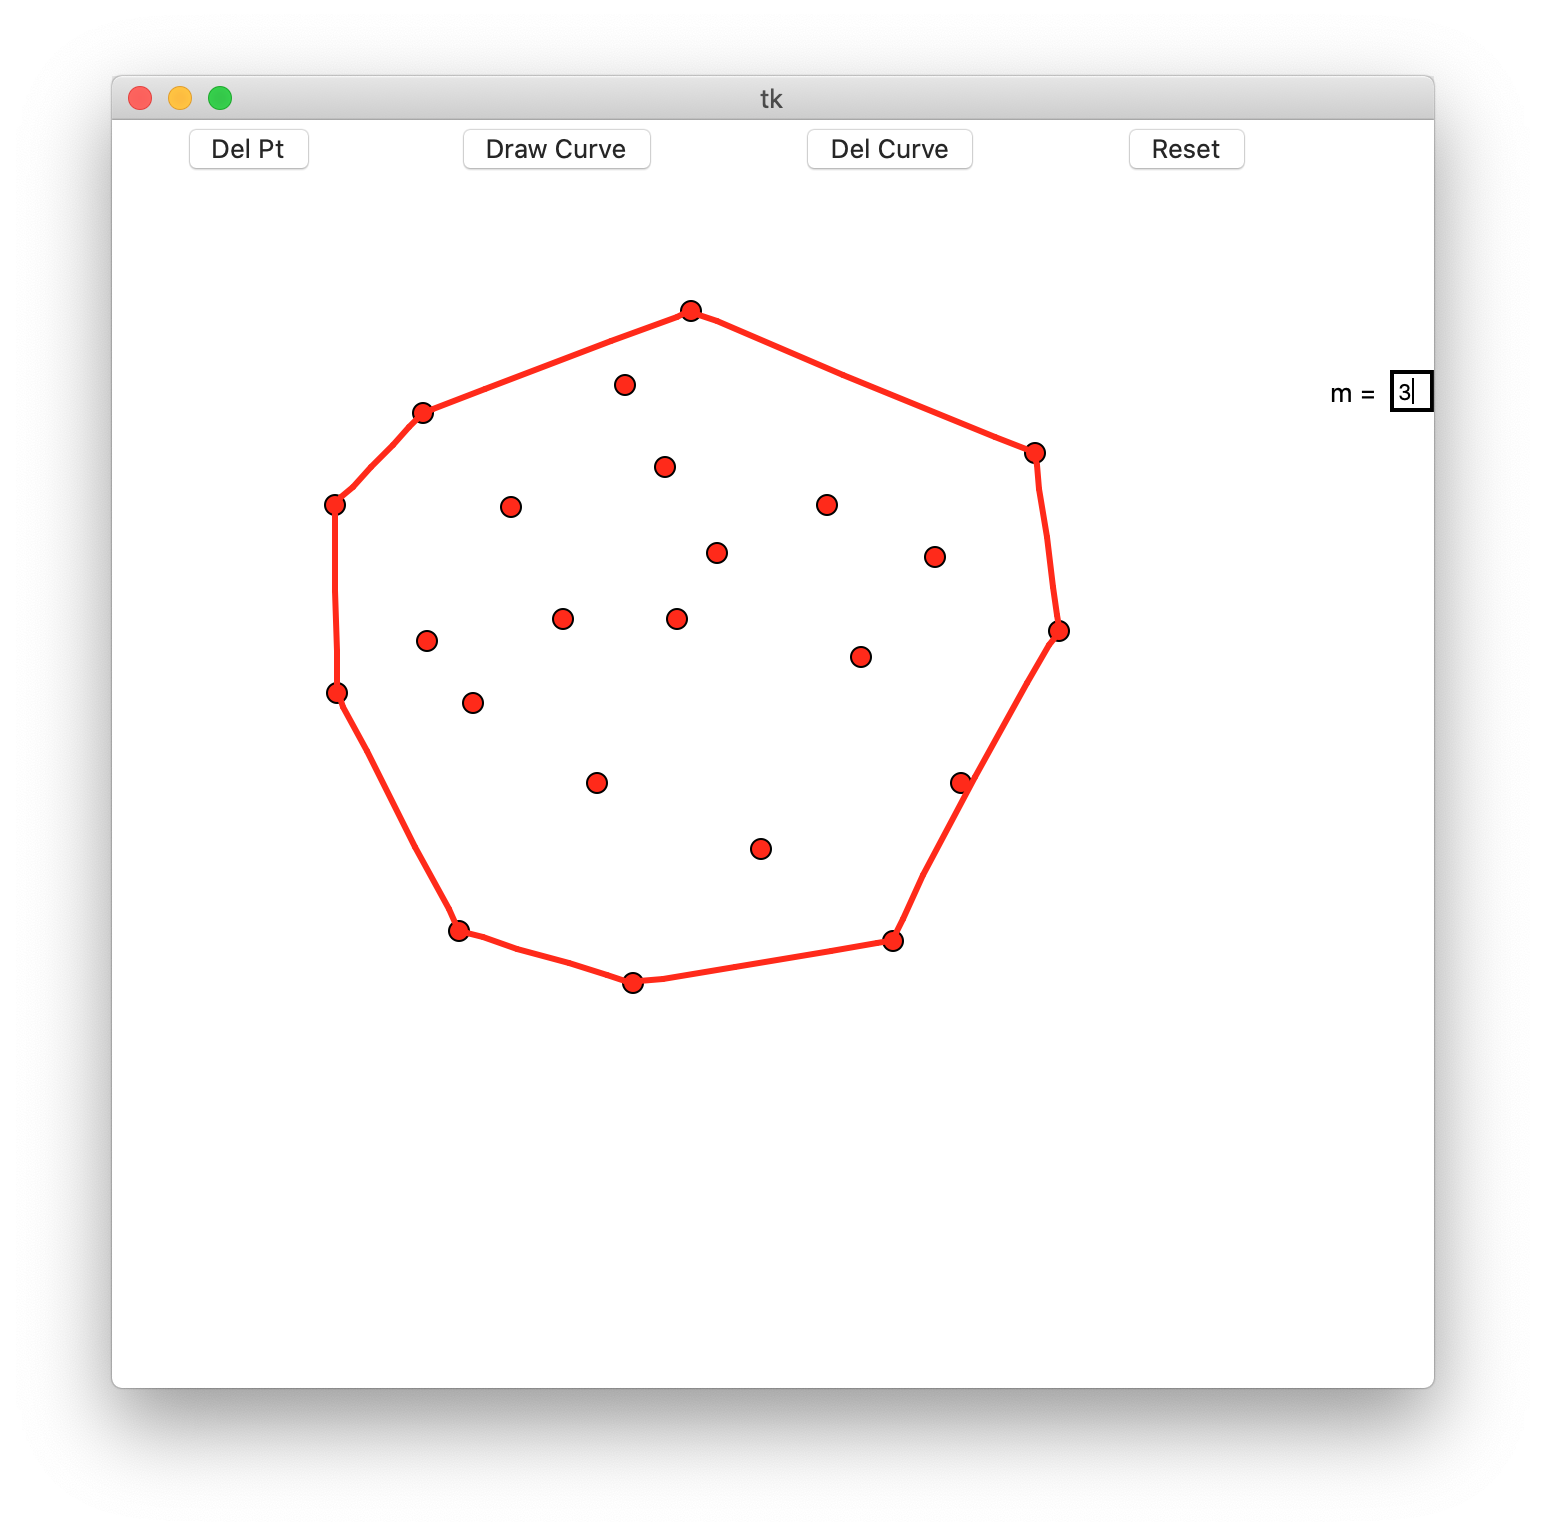
Edit 3: I wrote a GUI interface using the Python library Tkinter. Now I can place the points on a canvas, press a button and see the resulting curve. This will enable me to experiment further with these curves. After consulting with a few people, I think this may fit in a journal of Computer Graphics perhaps. It may not be appropriate in a journal of Approximation theory or Numerical Analysis I think, as it does not really contain results, as of now. In any case, I will let things stew a bit more in my brain before writing things up. Thank you all.
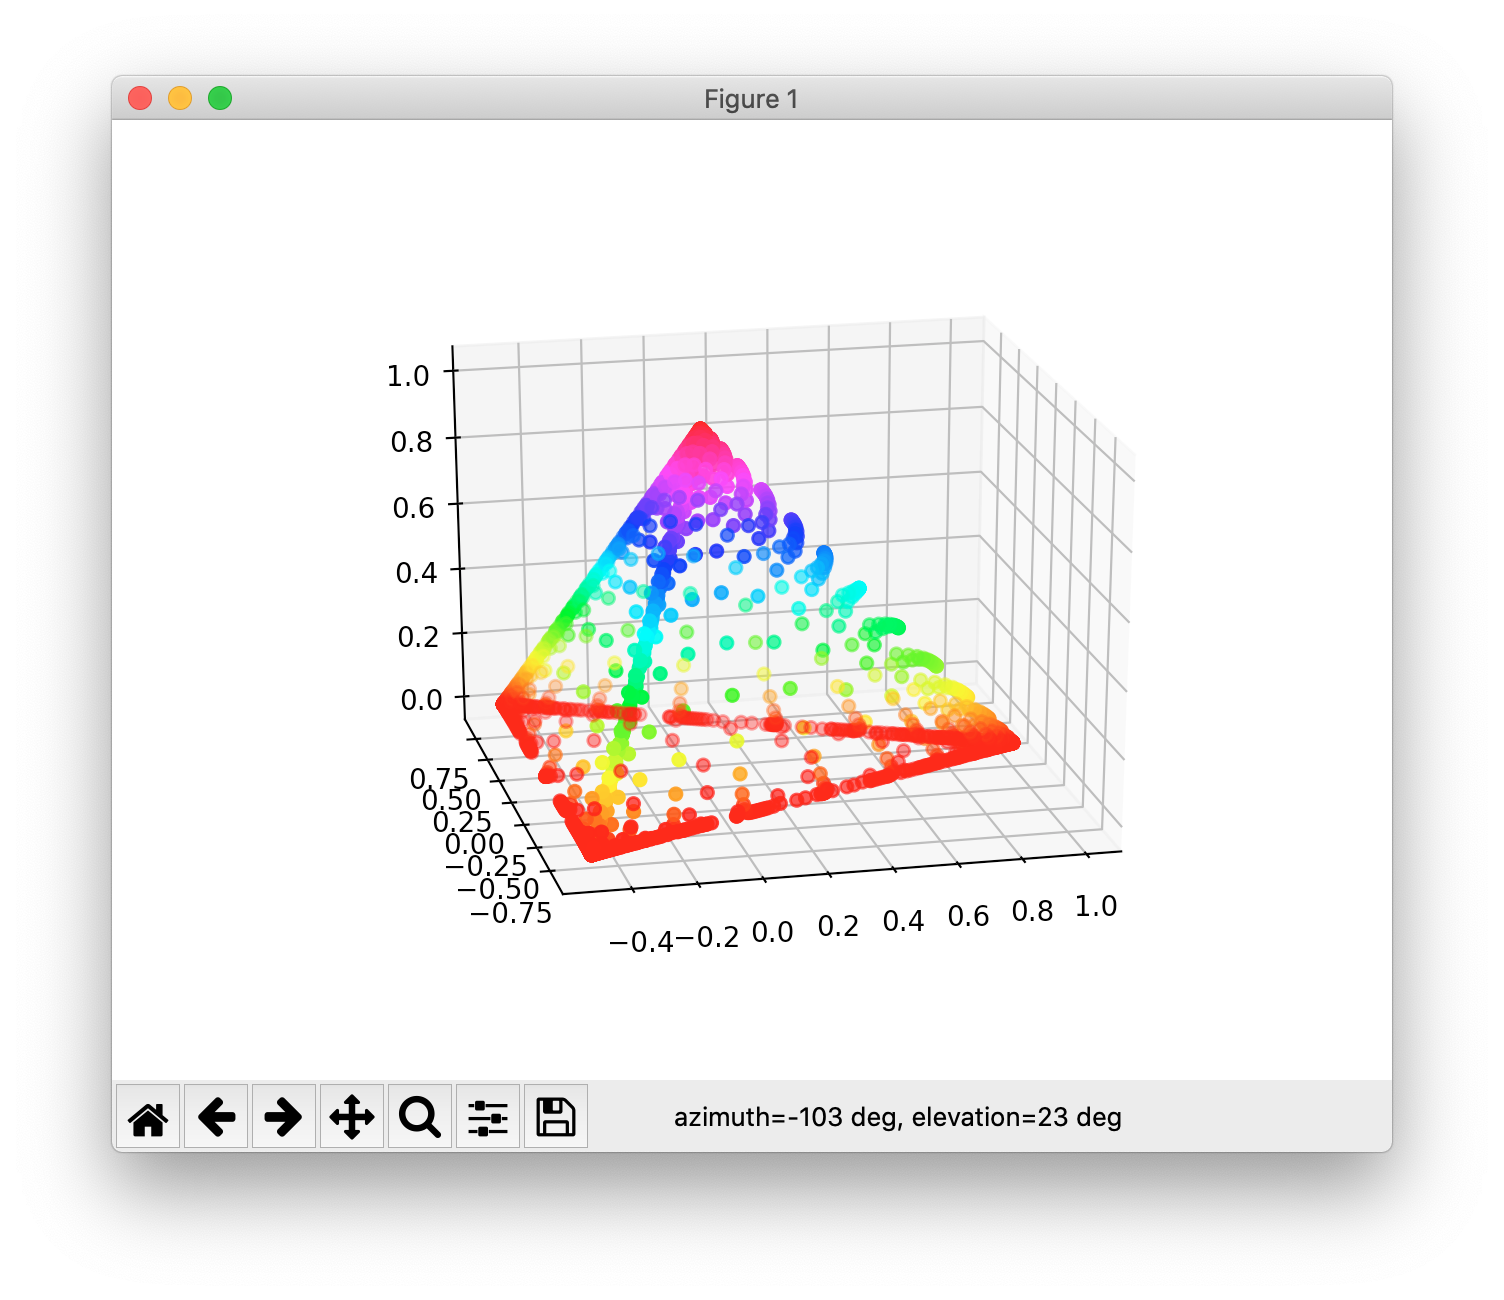
Edit 4: I saw how to generalize my maps in two different directions: as a sequence of maps, and in higher dimension. More specifically, I have defined, for each positive integer $m$, a real analytic map: $$f_m: C_n(\mathbb{R}^d) \times S^{d-1} \to \mathbb{R}^d,$$ such that, given $\mathbf{x} \in C_n(\mathbb{R}^d)$ (where $C_n(\mathbb{R}^d)$ denotes the configuration space of $n$ distinct points in $\mathbb{R}^d$), the map $f_m(\mathbf{x},-)$ maps the $d-1$ dimensional sphere to a good approximation of the boundary of the convex hull of $\mathbf{x}$. In the cases I considered, it seems that small values of $m$ suffice in practice (I mostly experimented in 2d and a little bit in 3d). Here is the plot of the images of some sample points on the sphere, for the case where $\mathbf{x}$ is the configuration of the $4$ vertices of a regular tetrahedron. I used $m=3$. I also include a 2d example, with $m=3$ (my previous map corresponds to $m=1$).
Edit 5: I uploaded a short note on arXiv. In case someone is interested in knowing how my maps are defined: Rational Maps and Boundaries of Convex Hulls, arXiv:2004.04538. I submitted this short note to a journal for review (sorry for all the updates).
Edit 6, UPDATE: Peter Olver found a counterexample to my conjecture in the arXiv article in Edit 5, so I will withdraw it, BUT this led to a fruitful collaboration where, after modifying the definition of the maps, we were actually able to prove convergence in the preprint Continuous Maps from Spheres Converging to Boundaries of Convex Hulls, arXiv:2007.03011. However, the maps are only piecewise rational, yet they are continuous. I am curious to know what people think of our preprint, for the ones who are interested enough to read it!

