I'm writing with respect to the paper Khatun, Dutta, and Tarafdar - "Islands in Sea" and "Lakes in Mainland" phases and related transitions simulated on a square lattice.
Here's a link to a PDF version.
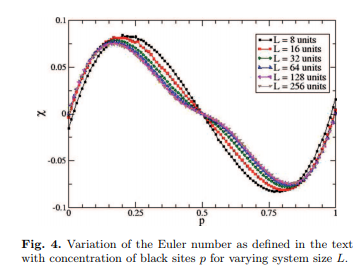
The Euler number $\chi(p)$ has been defined as $N_B(p)-N_W(p)$, where $N_B(p)$ and $N_W(p)$ are the numbers of black clusters and white clusters respectively at a probability $p$. [$p$ is the probability of a square being black.]
Now, in this image (from the cited paper), we can see the graphical plots of $\chi$ vs. $p$ graphs for different system sizes. As the system size increases there are two inflection points (say at $P_{L1}$ and $P_{L2}$) which become more and more prominent. One of my lab-mates plotted the graphs for $L=500$ and $L=1000$ and reported that those two inflections points were slowly tending towards $P_1=1-0.59$ and $P_2=0.59$.
So, basically their claim was that: \begin{align*} \lim_{L\to\infty} P_{L1} = P_1 & {}= 0.41 \\ \lim_{L\to\infty} P_{L2} = P_2 & {}= 0.59. \end{align*} Surprisingly, $0.59$ is the exact site percolation threshold for square lattice (with $z=4,\bar{z}=4$), as stated on Wikipedia.
I've been thinking about this for quite some time, but I have no idea as to why the inflection point as $L\to\infty$ would converge to $0.59$ (i.e., the spanning cluster site percolation threshold). Their claim might also be wrong, since they had just done the plotting up to $L=1000$. I would be glad if someone can prove that the claim is "wrong" (or even "right").
Also, is there any mathematically "exact" way to predict the values of $p$'s, at which the two inflections respectively occur?

