6
$\begingroup$

My question is related to this article by Oliver and Soundararajan (article about a bias in the distribution of the last digits of consecutive prime numbers).

After trying some python experimental researches on the prime gaps, I notice a bias in the gaps around each last digits {1,3,7,9}.

Could this bias be intrinsically linked to the bias found in the distribution of the last digits of consecutive prime numbers?

Experimental results

Here some experimental plot results up to the 3,500,000th prime number.
Two set-ups are calculated:
1. Cumulative and average gaps
2. Cumulative and occurence of particular gap size


1. Cumulative and average gaps

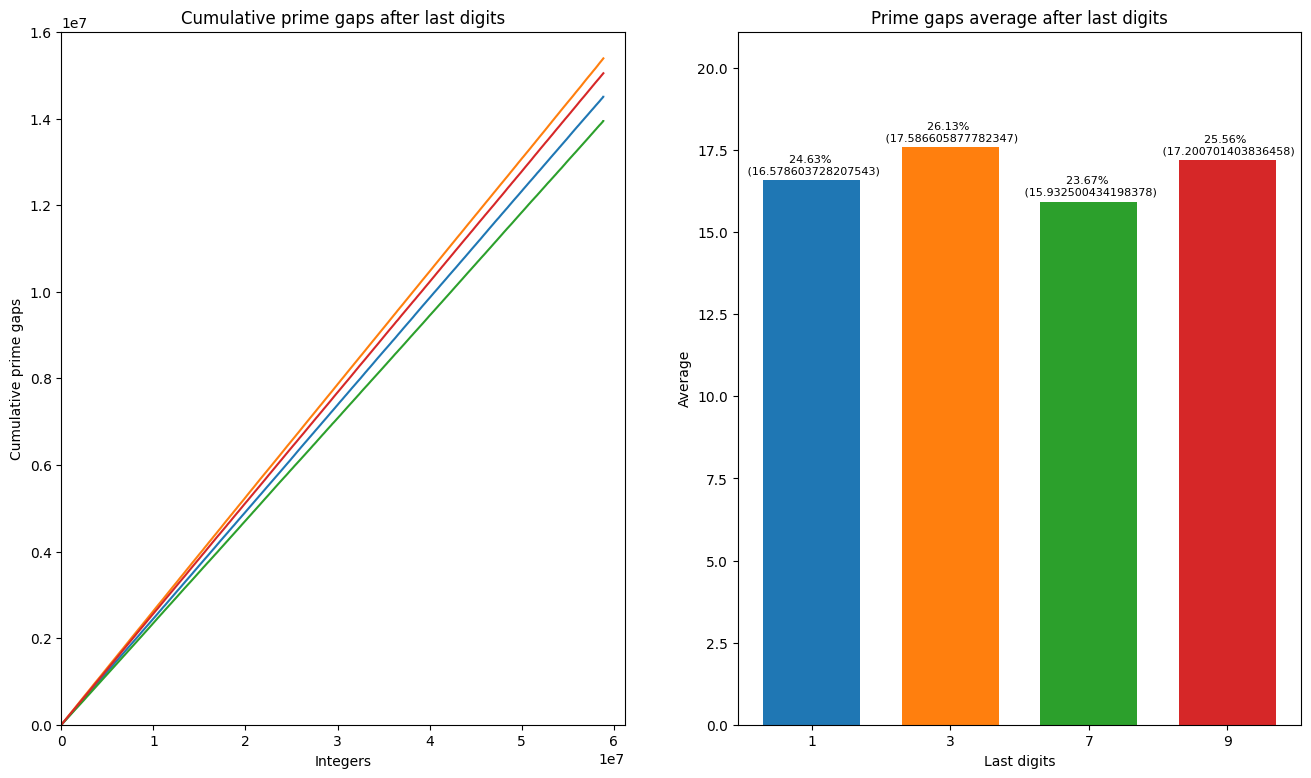
  • 1.1 Cumulative/average prime gaps after last digits:

Cumulative/average prime gaps **after** last digits + Cumulative/average prime gaps before last digits

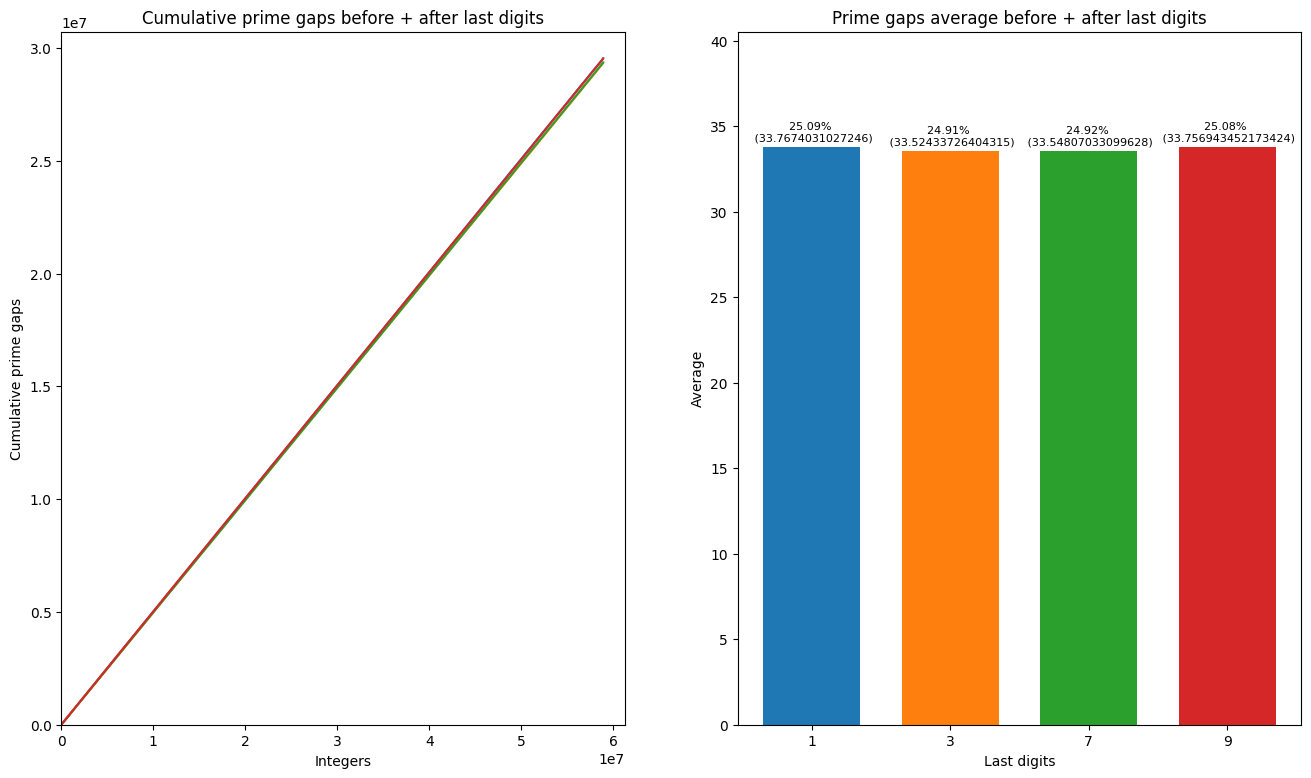
  • 1.2 Cumulative/average prime gaps before + after last digits

Cumulative/average prime gaps **before + after** last digits


2. Cumulative and occurence of a particular gap size

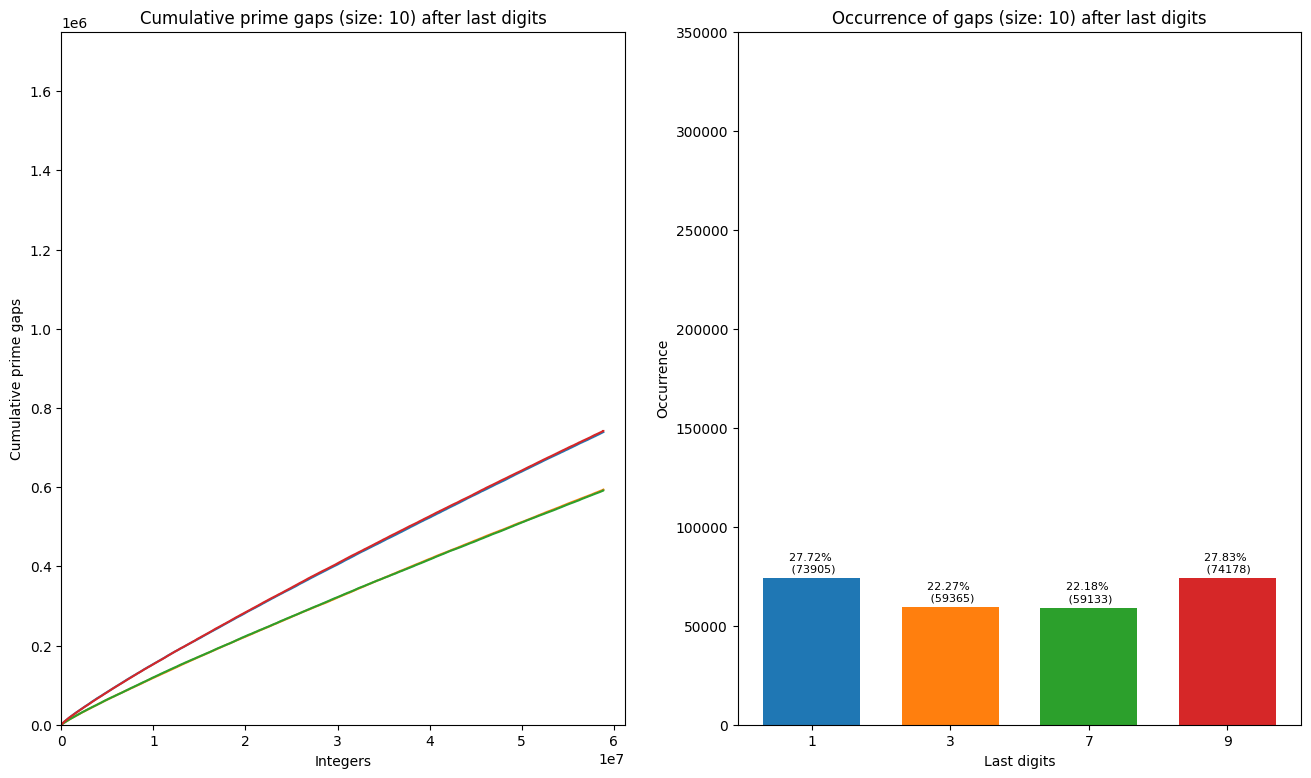
  • 2.1 Cumulative/occurence of gaps size of 10 after last digits

Cumulative/occurence of gaps size of 10 after last digits - Animated cumulative/occurence per incremented gap sizes after last digits


3. Misc

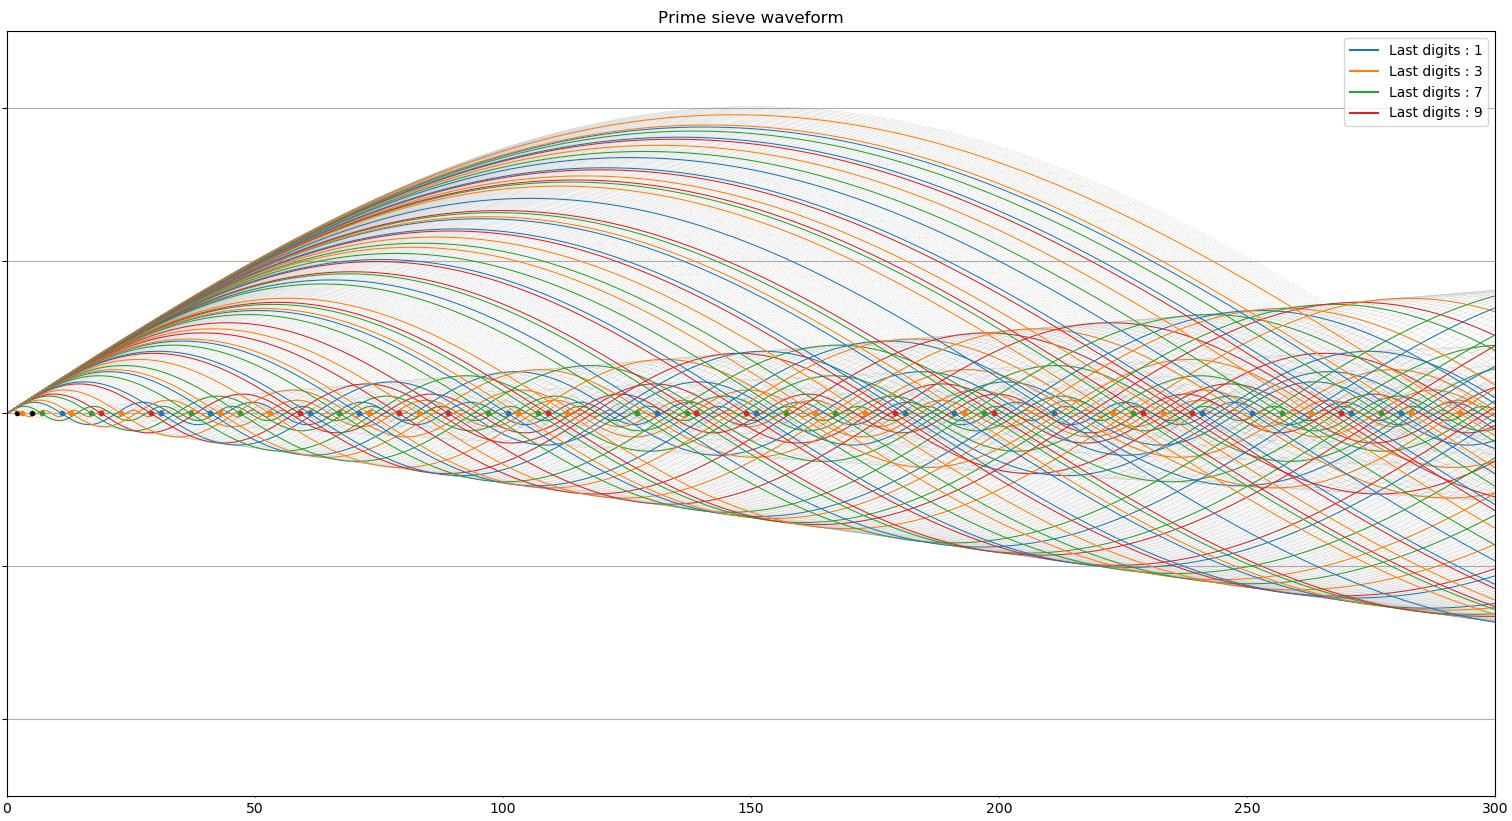
  • 3.1 Additional research on a waveform script of the sieve of Ératosthène, colored by last digits: plot 1 + plot 2

The script is on colab.research and is ready to fork

$\endgroup$
2
  • 4
    $\begingroup$ Why the downvotes? Perfectly reasonable question. $\endgroup$
    – Lucia
    Commented Apr 14, 2020 at 17:58
  • 3
    $\begingroup$ This bias probably exists and seems to be on the scale of $1/\log x$, which is different from the bias of size $\log \log x/\log x$ in Lemke Oliver and Soundararajan. You could analyze this in the same way, but I have not carried out the calculations. $\endgroup$
    – Lucia
    Commented Apr 14, 2020 at 18:03

1 Answer 1

10
$\begingroup$

Yes, it can be analyzed in the same way. Since the effects you're measuring are similar to each other, I'm only going to address the first one, cumulative prime gaps after primes with a fixed last digit. In Lemke Oliver and Soundararajan's paper, they count pairs of consecutive primes $p$ and $p_{\text{next}}$ up to $X$ satisfying $p \equiv a$ and $p_{\text{next}} \equiv b \pmod{10}$, or a sum of the form $$\sum_{\substack{h > 0 \\ h \equiv b-a}} \#\{ p \le x : p \equiv a \pmod{10}, p_{\text{next}} - p = h\}.$$ This setting can be described by two variations to the above sum. First, by summing the prime gaps, each term is being weighted by $h$. Second, since it's all prime gaps after primes with a fixed last digit, the expression is also summed over possible choices of $b$.

Armed with these modifications their analysis should follow through very similarly. For example, the proof of Prop. 2.1 in their paper can be carried out, but instead of considering $$F_{q,\chi}(s) = \sum_{h \ge 1} \frac{\chi(h)}{h^s} \mathfrak S_q(\{0,h\}),$$ weighing each term by a factor of $h$ means that instead we're considering $F_{q,\chi}(s-1)$. The poles of this function have shifted, so the corresponding sum for $S_0(q,0;H)$ in the statement of Prop. 2.1 would have a leading term of linear size in $H$, rather than log size.

As Lucia commented, the bias seems to be on a smaller scale than the bias from the paper. This reduction in bias should be a result of summing over all values of $b$, which has some averaging effect. As a test of this, we can consider the Main Conjecture on page 2 and sum the $\log \log x /\log x$ term over all values of $b$ with fixed $a$; the result is that it disappears entirely, leaving the $1/\log x$ term.

Another crude experiment can be done by taking the data on page 2 of their paper, assuming that the gap is larger than zero but otherwise as small as possible, and computing what the corresponding sum would be in this case. For $a = 1$, this would be the sum $$10 \cdot \pi(x_0;10,(1,1)) + 2 \cdot \pi(x_0;10,(1,3)) + 6 \cdot \pi(x_0;10,(1,7)) + 8 \cdot \pi(x_0;10,(1,9)).$$ To compare to your data, one can take this a step further by treating the total of these sums as a ``total prime gap'' and taking the percentage of the total for each. The result of doing this with the values from page 2 is:

\begin{array}{c|cc} a & \text{Sum} & \text{Percent of total} \\ \hline 1 & 149655728 & 25.96 \\ 3 & 165705632 & 28.75 \\ 7 & 125284384 & 21.73 \\ 9 & 135805698 & 23.56 \\ \end{array} A huge limitation here is that these sums are heavily influenced by the chance that numbers coming immediately after $a$ have of being prime (in particular, they are in increasing order beginning at 5 mod 10). Lemke Oliver and Soundararajan explicitly address this effect, showing that it doesn't account for the full bias. And, in fact, this doesn't quite match the data that you have. Nevertheless, some discrepancy is visible even in this crude model.
$\endgroup$
4
  • $\begingroup$ First of all, I would like to thank you Vivian for your answer which allows me to understand more deeply the distinction to be made among the "full" bias. Your crude experiment with "virtual" deviations is very interesting. I now assume that my data displayed as a bar takes into account the full bias because of the averaging effect of summing over all values. Finally, the observed pattern of your sum calculated from the data on page 2 is not very far from my results in terms of occurrences between the last digits. $\endgroup$ Commented Apr 23, 2020 at 10:40
  • $\begingroup$ And I would be really confused to learn that the discrepancy visible on my 2.1 data (occurence of gaps size of 10 after last digits) is a unique result of $1/\log x$ term. Does this experimental research on the prime gaps around the last digits make sense to you? Does it need to be further investigated? $\endgroup$ Commented Apr 23, 2020 at 10:53
  • $\begingroup$ For counting gaps of size exactly 10, I'd still expect a $\log \log x/\log x$ term. Here you wouldn't see an averaging effect, since you care about the values (mod 10) of the prime before and the prime after the gap. So, it does make sense that these gaps would be bigger. An analogous "crude experiment" would be to assume that $\pi(x_0; 10,(1,1))$, for example, on page 2, counts only pairs of primes with gaps equal to 10, instead of all that are 0 mod 10. Then you could take their values of $\pi(x_0;10,(a,a))$ for $a = 1,3,7,9$ and compare to your data. $\endgroup$
    – vivian
    Commented Apr 23, 2020 at 18:09
  • $\begingroup$ My 2.1 plot is finally exactly what is computed page 2, which is an evidence. With data from page 2, we have: $\begin{array}{c|cc} a & \text{Sum} & \text{Percent of total} \\ \hline 1 & 4623042 & 25.50 \\ 3 & 4442562 & 24.50 \\ 7 & 4439355 & 24.48 \\ 9 & 4622916 & 25.50 \\ \end{array}$ While my data gives : $\begin{array}{c|cc} a & \text{Sum} & \text{Percent of total} \\ \hline 1 & 11726 & 28.33 \\ 3 & 8969 & 21.67 \\ 7 & 9023 & 21.8 \\ 9 & 11666 & 28.19 \\ \end{array}$ Biases clearly follow the same pattern but diminish on larger $x$ due to $\log \log x/\log x$ term i guess $\endgroup$ Commented Apr 23, 2020 at 19:51

You must log in to answer this question.

Not the answer you're looking for? Browse other questions tagged .