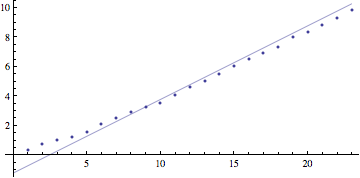
Since the Riemann hypothesis is equivalent to $\pi(x) = \text{Li}(x) + O(\sqrt x \log x)$,
One would expect that a plot of $|\pi(x) - \text{Li}(x)|$ and $\sqrt x \log x$ would show $|\pi(x) - \text{Li}(x)|$ coming near $\sqrt x \log x$. For values of $x$ up to even $10^8$ this does not happen. Does anyone know when the predicted asymptotic behavior shows up in a plot?

