Sorry for such a direct question:
Consider the following integral:
$$I(t)=\int_{1/2}^{1} {\log|\zeta(a+it)|}da.$$
How to find the nature of $I(t)$ as $t\rightarrow\infty$?
Sorry for such a direct question:
Consider the following integral:
$$I(t)=\int_{1/2}^{1} {\log|\zeta(a+it)|}da.$$
How to find the nature of $I(t)$ as $t\rightarrow\infty$?
Numerical calculations done with Mathematica
Table[NIntegrate[Log[Abs[Zeta[a + I*t]]], {a, 1/2, 1}], {t, 100,30000, 100}]
$\begin{align*}\{ &0.355184,0.67369,-0.0511692,-0.116742,0.0869972,0.313887,-0.126047,0.18184,\\ &-0.482381,-0.0520365,-0.0750188,-0.0256284,-0.0885873,-0.536367,\\ &-0.408367,-0.650474,-0.613108,-0.461026,-0.590794,-0.271635,0.148132,\\ &-0.205384,-0.13475,-0.269913,-0.113494,-0.144162,-0.0300384,-0.071705,\\ &0.825947,0.376439,0.968618,0.462564,0.686096,0.355407,0.452674,0.0681048,\\ &0.521999,-0.264049,0.368498,-0.593214,-0.0937592,-0.0800578,-0.237043,\\ &-0.0915343,-0.366326,-0.575656,-0.31372,-0.759774,-0.0109303,-0.232602,\\ &-0.216198,-0.0788632,-0.566224,-0.100116,-0.103021,-0.0908203,0.19646,\\ &-0.0656227,-0.257867,0.379636,0.244727,0.907306,0.398176,0.778883,0.0799301,\\ &0.733358,0.204557,0.691673,-0.148087,0.331277,-0.434064,0.184642,0.188583,\\ &-0.0544067,-0.132409,-0.324455,-0.861503,-0.193575,-0.267022,-0.289396,\\ &-0.525734,-0.765741,-0.465548,-0.273807,-0.188376,0.12562,-0.292584,\\ &-0.0286449,0.0106804,-0.172691,0.411111,-0.251824,0.488146,0.436248,0.738702,\\ &0.61175,0.36111,0.265756,0.375469,-0.274686,0.652807,0.00908037,0.163581,\\ &-0.136644,-0.0216155,-0.4452,-0.0576776,-0.345097,-0.152329,-0.322914,\\ &-0.26072,-0.334408,-0.418893,-0.436646,-0.250196,-0.125129,0.00158975,\\ &-0.46263,-0.310313,-0.332519,-0.42627,0.581048,0.26465,0.461546,0.393654,\\ &0.341164,0.326698,0.437423,-0.121027,0.851876,-0.212558,0.371777,-0.294184,\\ &0.34115,0.160205,0.185217,-0.26511,0.0893656,-0.57917,0.200128,-0.349994,\\ &-0.195791,-0.24978,-0.265096,-0.247507,-0.0802933,-0.260665,-0.143762,\\ &-0.795874,-0.652132,0.0709754,0.170081,0.524767,-0.170425,0.275894,\\ &0.0966737,0.43712,0.102661,0.767825,-0.240928,0.286522,-0.00335062,0.115249,\\ &0.358749,0.418314,-0.0675869,0.25785,-0.40103,-0.0376437,-0.574971,0.22054,\\ &-0.290544,0.135291,0.127638,-0.0670916,-0.469431,-0.209039,-0.627268,\\ &-0.0352671,-0.479116,-0.395794,-0.244311,-0.245332,0.263983,-0.0326612,\\ &0.272838,0.397678,0.318155,0.2517,0.336086,0.0492954,0.20833,-0.328821,\\ &0.385369,0.0900924,0.495336,0.0101933,0.169302,-0.577088,0.100922,\\ &-0.438994,0.374291,0.0160434,0.0999525,-0.286689,-0.190298,-0.486922,\\ &0.322745,-0.305681,-0.166561,-0.461854,-0.360871,0.129377,-0.119005,\\ &-0.245055,0.18998,0.0381758,0.370571,0.145652,0.300324,0.60346,\\ &-0.222388,0.0837122,0.0647607,0.452066,0.196731,0.104022,-0.0314324,\\ &0.0458204,-0.332051,0.553355,-0.0849716,0.0186122,-0.354049,-0.0710683,\\ &-0.254197,0.280613,-0.261235,0.437233,-0.344157,-0.103659,-0.17867,-0.102029,\\ &-0.264825,-0.229886,-0.372701,0.265029,-0.0917961,0.133964,0.359779,\\ &0.251413,0.258358,0.269928,0.151232,-0.0749515,-0.0246962,-0.123768,\\ &0.0371501,-0.25699,0.55115,-0.491478,0.43279,-0.258078,-0.0735431,-0.266812,\\ &-0.237243,-0.477857,0.307124,-0.294167,0.508087,-0.276434,-0.20711,\\ &-0.221812,0.0475171,0.200148,-0.0000837041,-0.106971,-0.0471219,-0.249783,\\ &0.142067,0.576203,0.345696,0.400241,-0.0934408,0.107647,0.305244,0.204552,\\ &0.132629,-0.0247063,-0.342496,0.178626,-0.181818,0.125482,-0.39266,\\ &-0.297899,-0.241306,0.180825,-0.115697,0.512937,-0.256509\}\end{align*}$
show no regularity.
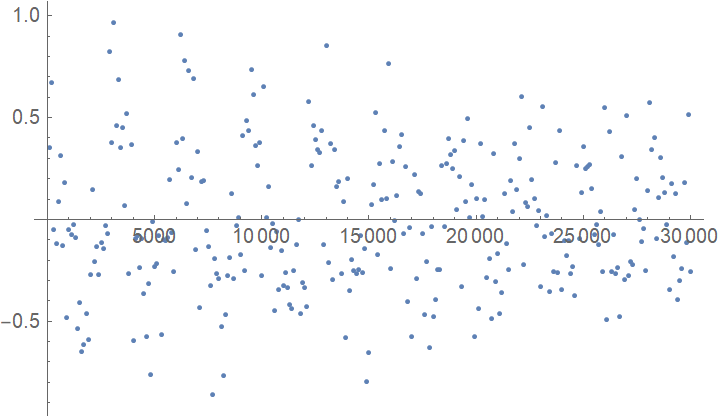
PS. Here is the plot of the above data.

Addition.
f[t_NumericQ] := NIntegrate[Log[Abs[Zeta[a + I*t]]], {a, 1/2, 1}]
NMaximize[{f[t], t >= 1 && t <= 10^7}, t,  Method -> {"DifferentialEvolution",
"ScalingFactor" -> 2}, AccuracyGoal -> 4, PrecisionGoal -> 4]
$\{2.08333,\{t\to 1.87083\}\}$
NMinimize[{f[t], t >= 1 && t <= 10^7}, t, Method -> {"DifferentialEvolution", "ScalingFactor" -> 2}, AccuracyGoal -> 4, PrecisionGoal -> 4]
$\{-3.33333\times 10^{27},\{t\to 1.\times 10^7\}\}$
As suggested in a comment, here are some plots:
Plot[NIntegrate[Log[Abs[Zeta[a+I t]]],{a,1/2,1}],{t,1,50}]
ParametricPlot[ReIm[NIntegrate[Log[Zeta[a+I t]],{a,1/2,1}]],{t,1,50},PlotPoints->150]