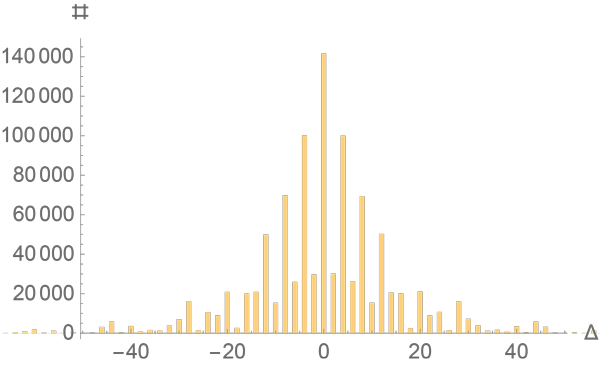
I was naively exploring the (usually) composites $\pm 2$ from a prime $p$, wondering if there might be some asymmetry, and made this histogram of the difference $\Delta$ in the number of divisors of $p \pm 2$:

Histogram of $\Delta(p)$ for the 1st $10^6$ primes $p$. The million$^{\mathrm{th}}$ prime is $15485863$.
More precisely, define $\Delta(n)$ to be $\tau(n+2)-\tau(n-2)$, where $\tau$ counts the number of divisors. The histogram shows the number of $\Delta(p)$ values just for $p$ a prime, for the first million primes.
For example:
- For $p=29$, $p+2=31$ is prime and so has $2$ divisors $\{1,31\}$ while $p-2=27$ has $4$ divisors $\{1,3,9,27\}$. So $\Delta(29) = -2$, and this contributes $1$ to the $\Delta=-2$ bar of the histogram.
- For $p=47$, $p+2=49$ has $3$ divisors $\{1,7,49\}$ while $p-2=45$ has $6$ divisors $\{1,3,5,9,15,45\}$. So $\Delta(47) = -3$, and this contributes $1$ to the $\Delta=-3$ bar of the histogram.
- For $p=523$, $p+2=525$ has $12$ divisors $\{1, 3, 5, 7, 15, 21, 25, 35, 75, 105, 175, 525\}$ while $p-2=521$ is prime and so has $2$ divisors $\{1,521\}$. So $\Delta(523) = 10$, and this contributes $1$ to the $\Delta=10$ bar of the histogram.
My question is:
Q. What explains the structural features of this histogram? In particular:
- Why are odd $\Delta$ values so much smaller than even values? Note: They are (in general) non-zero. For example, among the first $10^6$ primes, $39$ have $\Delta=1$ and $31$ have $\Delta=-1$.
- Why is the histogram so symmetric? For example, among the first $10^6$ primes, $100016$ have $\Delta=4$ and $100280$ have $\Delta=-4$.
- Why do the $\Delta$'s divisible by $4$ ($0,\pm 4, \pm 8, \ldots$) appear to follow one normal distribution,
- while the $\Delta$'s in between ($\pm 2, \pm 6, \pm 10, \ldots$)—equal $2 \bmod 4$—appear to follow a lower-amplitude normal distribution.
Other features are visible at larger $|\Delta|$ values, but perhaps these would wash out as $p \to \infty$.
