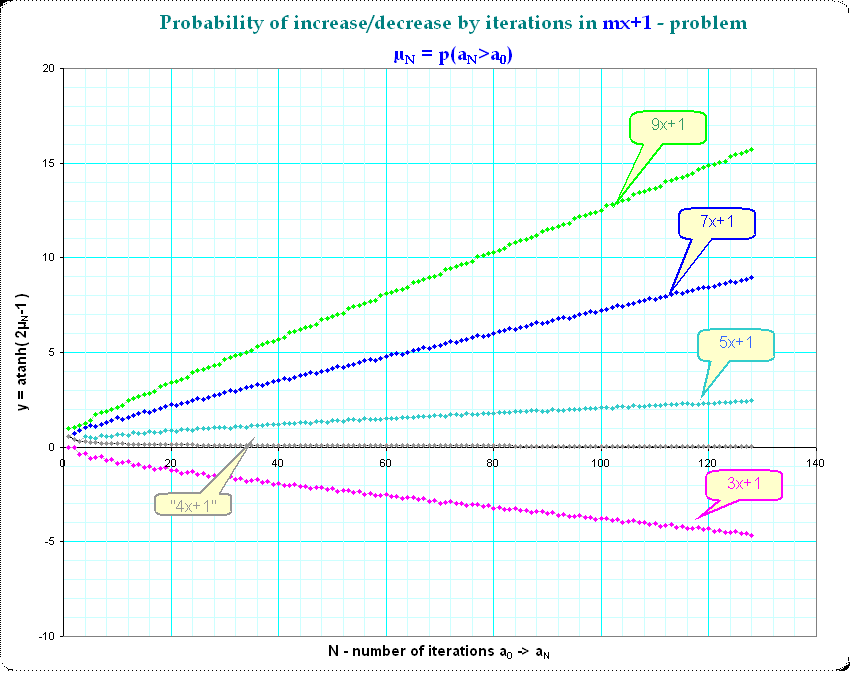
It might be a nice illustration of the general behaviour of increasing/decreasing by iterations from a purely statistical view.
Consider some number odd number $a_0$ Then in the $mx+1$-problem, $a_1 = (ma_0+1)/2^A$ and the likelihood of $ma_0+1$ having $2^A$ as factor is just $1/2^A$. From this the likelihood, $ p(a_1 \ge a_0)$ can be computed. This can then be iterated to, say, $N$-iterations and the probability $ \mu_N = p(a_N \ge a_0)$ can be computed the obvious way.
Probabilities $ \mu_N $ are between $0..1$; and the curves for different problem-parameters $m$ are not much detailful. So I also did a transform $y_{m,N} = \tanh^{-1}( 2\mu_{m,N}-1)$. Here are the curves for the transformed probabilities:

I've inserted also the fictive "4x+1"-curve although that problemparameter $m=4$ does not make sense in reality. We see, that all curves except that of $m=3$ and $m=4$ increase, that means, the probability that $a_{m,N} \ge a_{m,0}$ for increasing number of iterations tends to $1$ for all problemparameters $m \ge 5$
Moreover, I find it amazing, that the increase of the $y$-values are asymptotically linear with the number of iterations (but didn't investigate this further).
Important remark: Of course, the statistical view does not "see" exceptional cases like occurence of cycles, if their number is small. For instance, in the $5x+1$-problem we actually we know a few cycles, but without that few exceptions statistically the trajectories of most numbers $a_{5,0}$ seem to diverge. This view can only give the "big picture".

