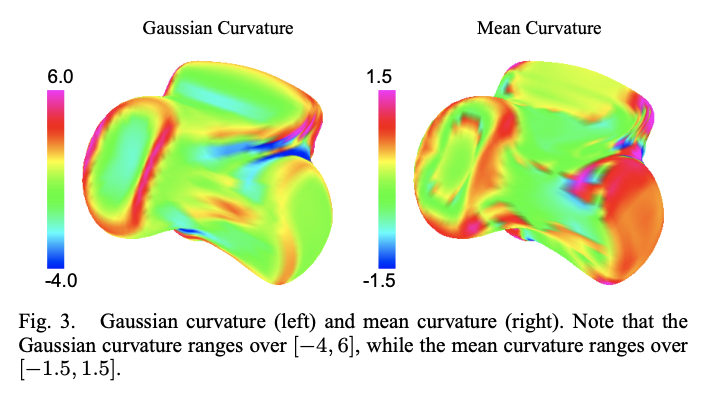
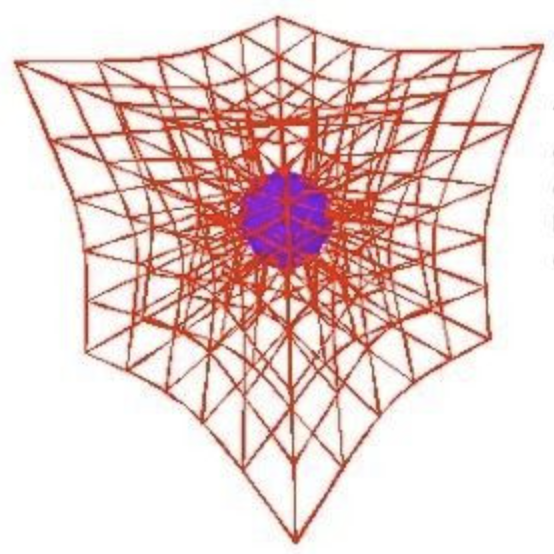
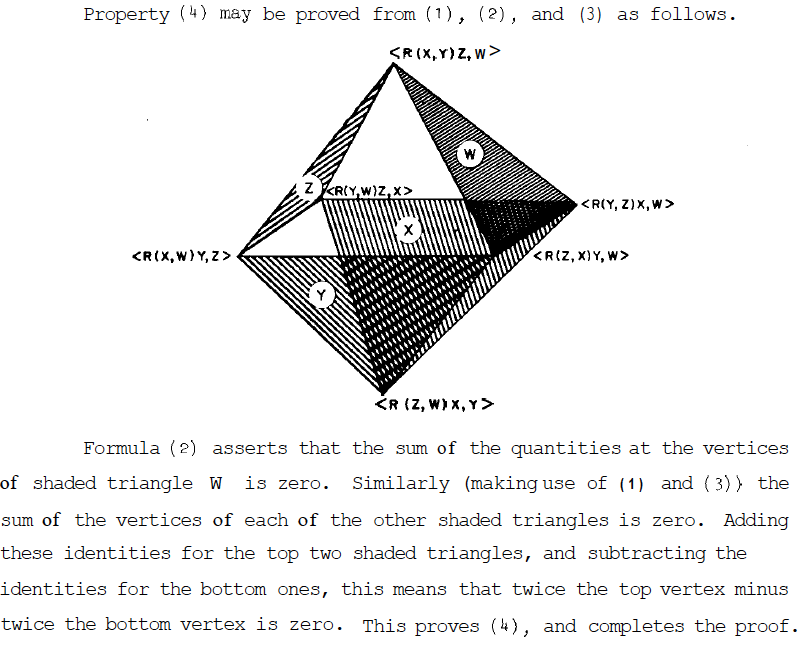
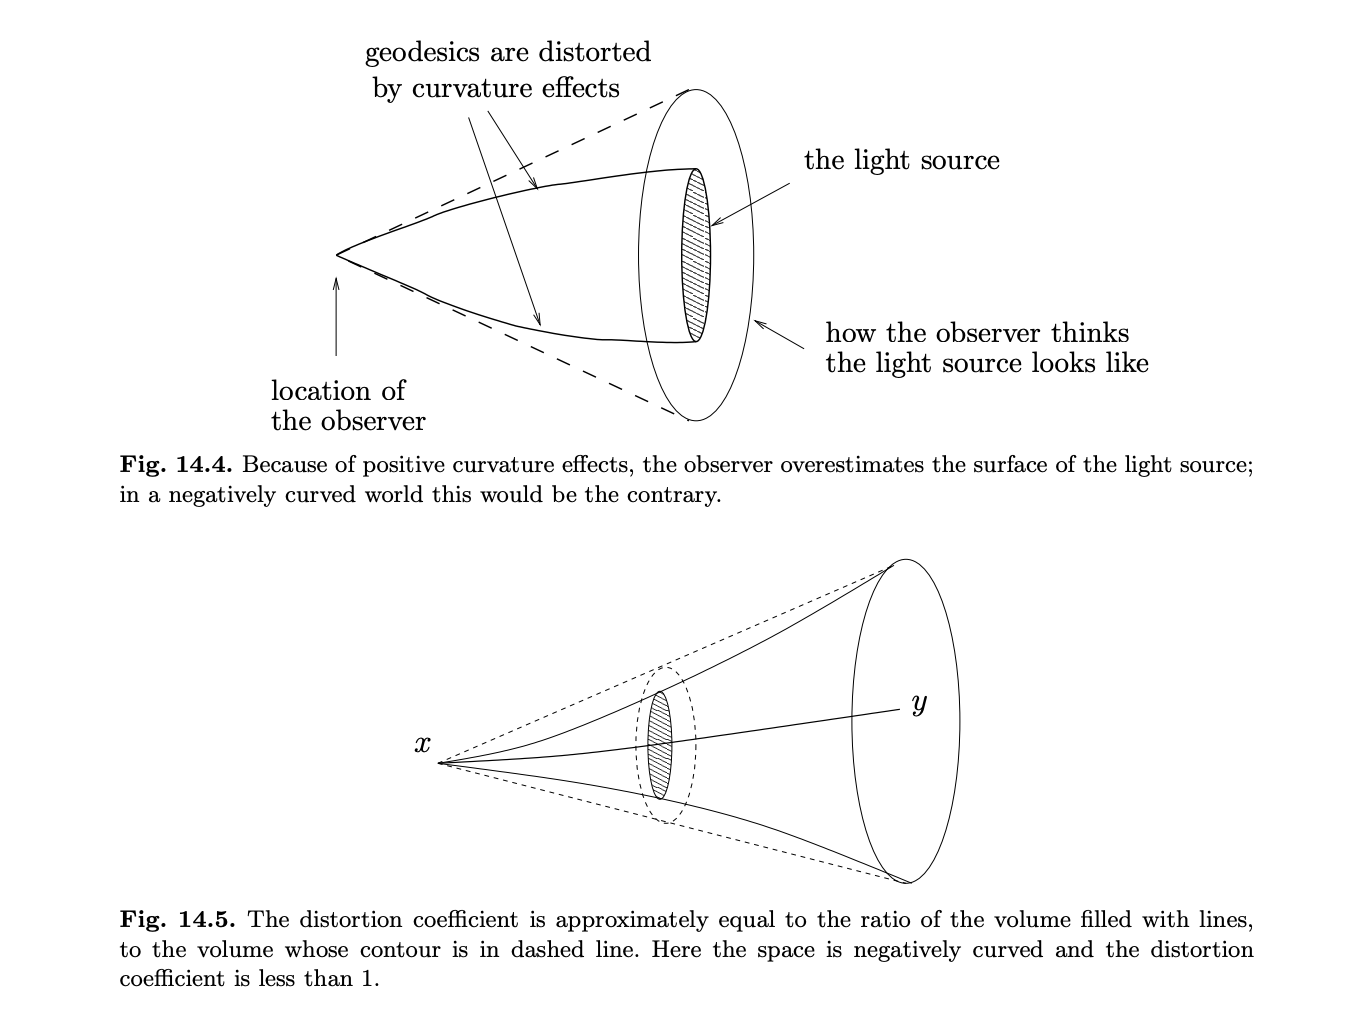
This is more of a pedagogical question rather than a strictly mathematical one, but I would like to find good ways to visually depict the notion of curvature. It would be preferable to have pictures which have a reasonably simple mathematical formalization and even better if there is a related diagram that explains torsion.
One common picture
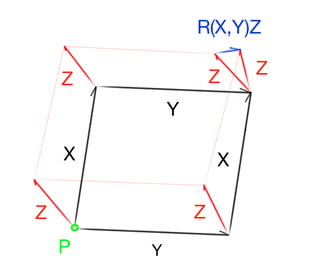
I've often used the above schematic to think about the Riemann curvature tensor $$R(X,Y)Z = \nabla_X \nabla_Y Z - \nabla_Y \nabla_X Z + \nabla_{[X,Y]} Z.$$
This diagram intuitively shows that the curvature involves the difference of covariant derivatives. However, it doesn't really explain why there is another term in the formula (i.e., $\nabla_{[X,Y]} Z$). Also, it takes some work to translate the picture into a precise and correct mathematical formula.
One way to formalize this (suggested by Robert Bryant) is to consider a parallelogram with sides $\epsilon X$ and $\epsilon Y$ in $T_p M$. Then the diagram depicts the parallel transport of $Z$ along the exponential of the sides of the parallelogram. To understand the picture, you parallel transport the vector labelled $R(X,Y)Z$ back to $p$, divide by $\epsilon^2$ and let $\epsilon$ go to $0$. This interpretation is conceptually simple, but has the disadvantage that the top and right hand sides of the parallelogram are not geodesics, so we cannot use this interpretation to draw a similar diagram for torsion.
There are other ways to formalize this diagram, and it would be interesting to hear other simple and correct explanations for this picture (or any variation of it).
Another common picture
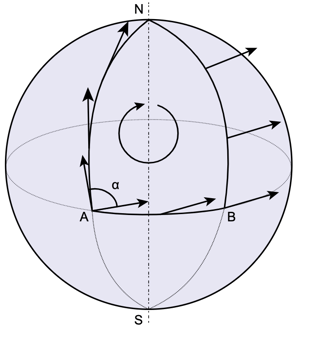
Another commonly used picture to explain curvature is a spherical triangle with two vertices on the equator and a third at a pole. This intuitively shows that curvature gives rise to holonomy, but also relies on the global geometry of the sphere. In other words, it doesn't really depict curvature as "local holonomy."

