-2
$\begingroup$

In one line: Given an exponentially decaying sine wave $x(t)$, how can we predict the amplitude of the resulting peak in frequency spectrum using discrete Fourier transform.

In nuclear magnetic resonance experiments, the raw data is an exponentially decaying sinuoid(s) as a function of time (t $\geq$ 0). In order to see the frequency spectrum the standard protocol is to do a Fast Fourier Transform (FFT) and display one-sided frequency spectrum 1.

a) Simple scenario: We have a non-decaying sine wave of frequency $\omega_0$ and amplitude $A$. FFT of this signal is two peaks (one corresponding to positive frequency and the other one at negative frequency situated at $\omega_0$ and amplitude $A/2$. Note that we have to normalize the FFT with the number of sampled points in order to get the right amplitudes in the frequency spectrum.

b) Real experimental scernaio: Let us say we have an exponentially decaying sine wave $x(t)$, then,

$$x(t) = A \sin(\omega_0 t) e^{-\alpha t} \, u(t)$$

where $u(t)$ is the Heaviside unit step function, $\alpha$ is positive and real. Now the key question is that in (a), we were able to predict the amplitude of the peaks in the frequency spectrum. It was $A/2$. In this exponentially decaying case, is there a way to predict the amplitude of the resulting peak in frequency spectrum?

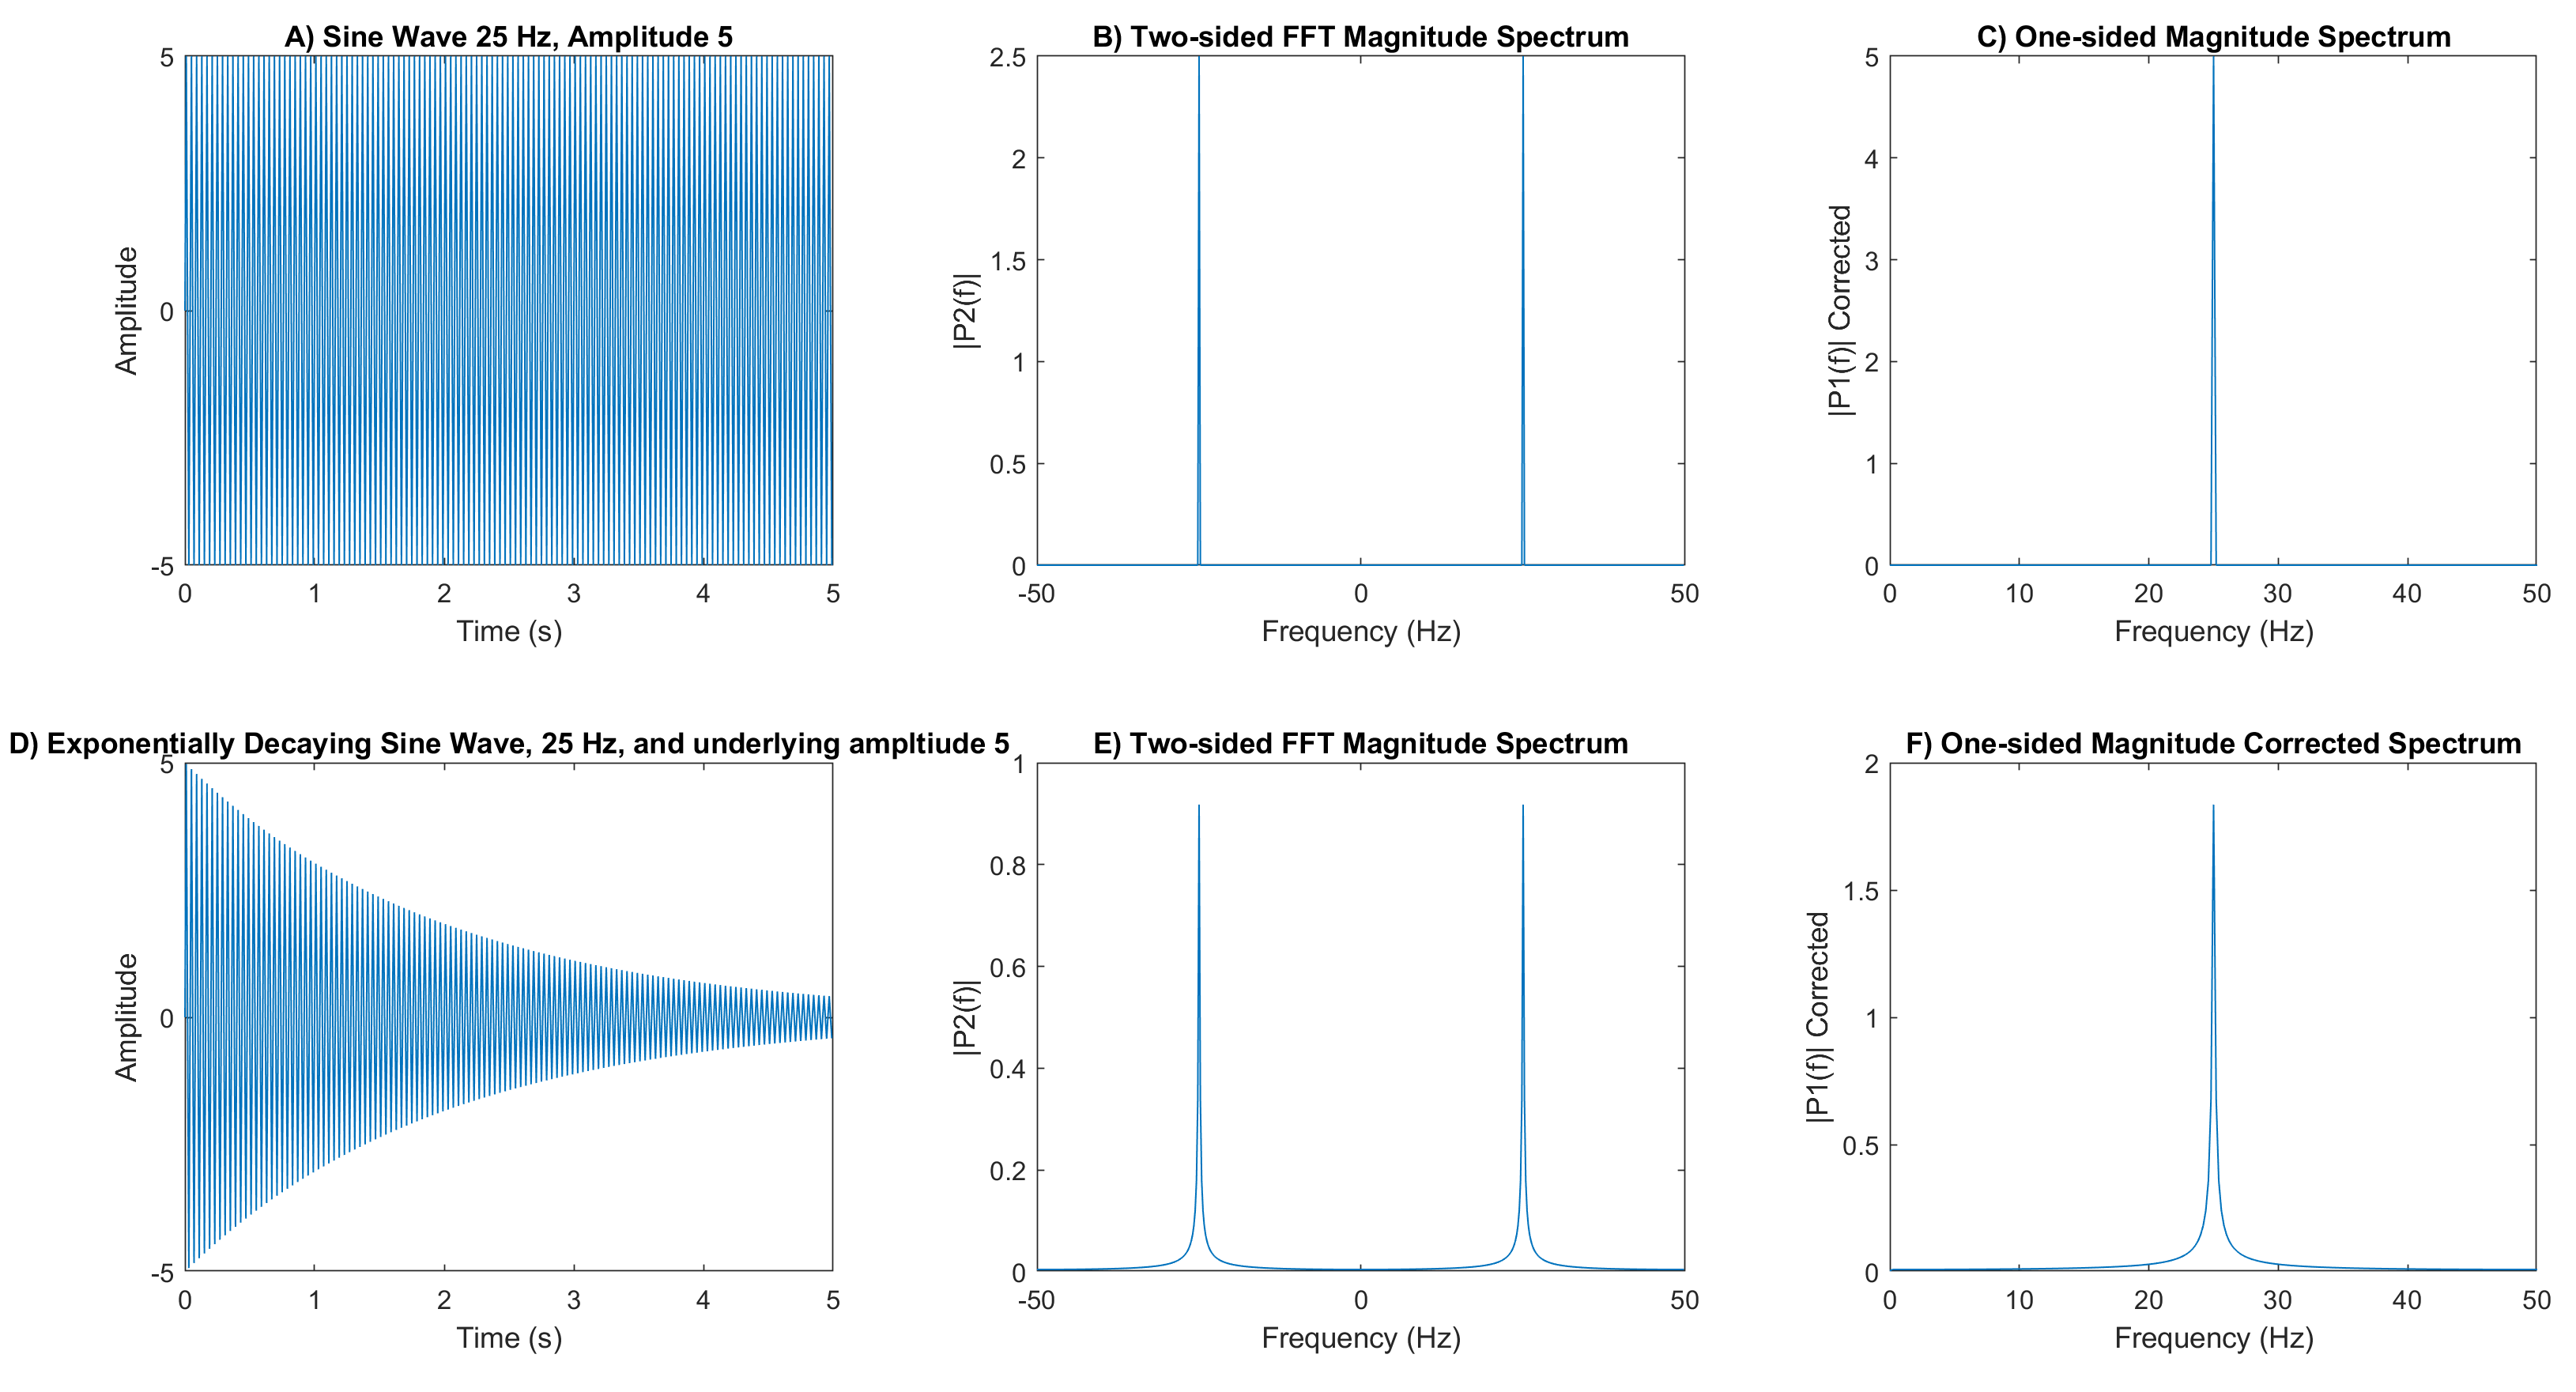
An annotated figure will clarify the question. Starting from (a) a sine wave with 25 Hz and amplitude of 5 will show up as a single peak in FFT spectrum of amplitude 5/2 (two sided version) or 5 in the one-sided spectrum.

Now the same sinusoid is multiplied by an exponential with $\alpha$= 0.5. We get a much less peak height in the frequency spectrum. In short, is there a way to predict this peak height if we know the decay constant and initial amplitude of the sine wave in FFT. Thanks.

image

$\endgroup$
13
  • 1
    $\begingroup$ I find it hard to make out what exactly you're asking here. What is given, what are you trying to determine? Are you saying that you have $X(\omega )$ at a discrete set of points (from a FFT), and you're trying to determine $A$? $\endgroup$ Commented Mar 13 at 16:48
  • 1
    $\begingroup$ I still don't understand what you're trying to find. What is a "peak height" or a "magnitude frequency spectrum"? Can you point out which property of your original expression $x(t)$ you're interested in? And again, what are the given data that you want to derive said property from? $\endgroup$ Commented Mar 13 at 18:44
  • 1
    $\begingroup$ Ok, now in early versions of your post you had $X(\omega)$. So, isn't the maximal value of the magnitude of $X(\omega)$ exactly what you're looking for? $\endgroup$ Commented Mar 14 at 6:14
  • 1
    $\begingroup$ I simulated in MATLAB using the built-in fft command for the Fourier transform where the exponentially dampened signal is defined as A*exp(-alpha* t) .*sin(2 * pi * frequency * t). Regardless of the size of the alpha value, there is no shift in the frequency domain at all. $\endgroup$ Commented Mar 14 at 19:14
  • 1
    $\begingroup$ You are looking for Laplace transform of $Sin(\omega t)$ at $s= \alpha+i\omega$. Simply consult the Laplace transform table $\endgroup$ Commented Mar 16 at 2:24

1 Answer 1

4
$\begingroup$

You can just Fourier transform your signal $$\hat{x}(\omega)=A\int_{0}^\infty \sin(\omega_0 t)e^{-\alpha t}\,e^{i\omega t}\,dt=\frac{A\omega_0}{\alpha^2-2 i \alpha \omega+\omega_0^2-\omega^2}.$$ The peak in $|\hat{x}(\omega)|^2$ for $\alpha<\omega_0$ is at $\omega=\pm\sqrt{\omega_0^2-\alpha^2}$ of height $A(8\pi \alpha^2)^{-1}$.

The limit $\alpha\rightarrow 0$ gives you delta function peaks, which will be regulated by the time discretisation step $\delta t$. For $\alpha\delta t>1$ the peak height will then decay as $1/\alpha$.


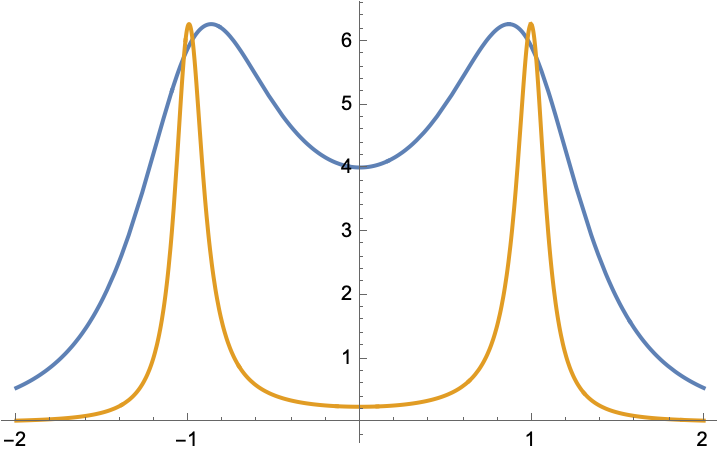
There has been a (now partially deleted) discussion whether the damping shifts the peak frequency. It does. To see this, I plot $$8\pi\alpha^2|\hat{x}(\omega)|^2=8\pi A^2\frac{(\alpha\omega_0)^2}{\left(\alpha^2+\omega_0^2\right)^2+2 \omega^2 (\alpha^2-\omega_0^2)+\omega^4}$$ as a function of $\omega$ for $\omega_0=1$, $A=1$, and $\alpha=0.1$ (gold) and $\alpha=0.5$ (blue).

The separation between the peaks is reduced by an amount $\alpha^2/\omega_0$ for $\alpha\ll\omega_0$.

$\endgroup$
0

You must log in to answer this question.

Not the answer you're looking for? Browse other questions tagged .