4
$\begingroup$

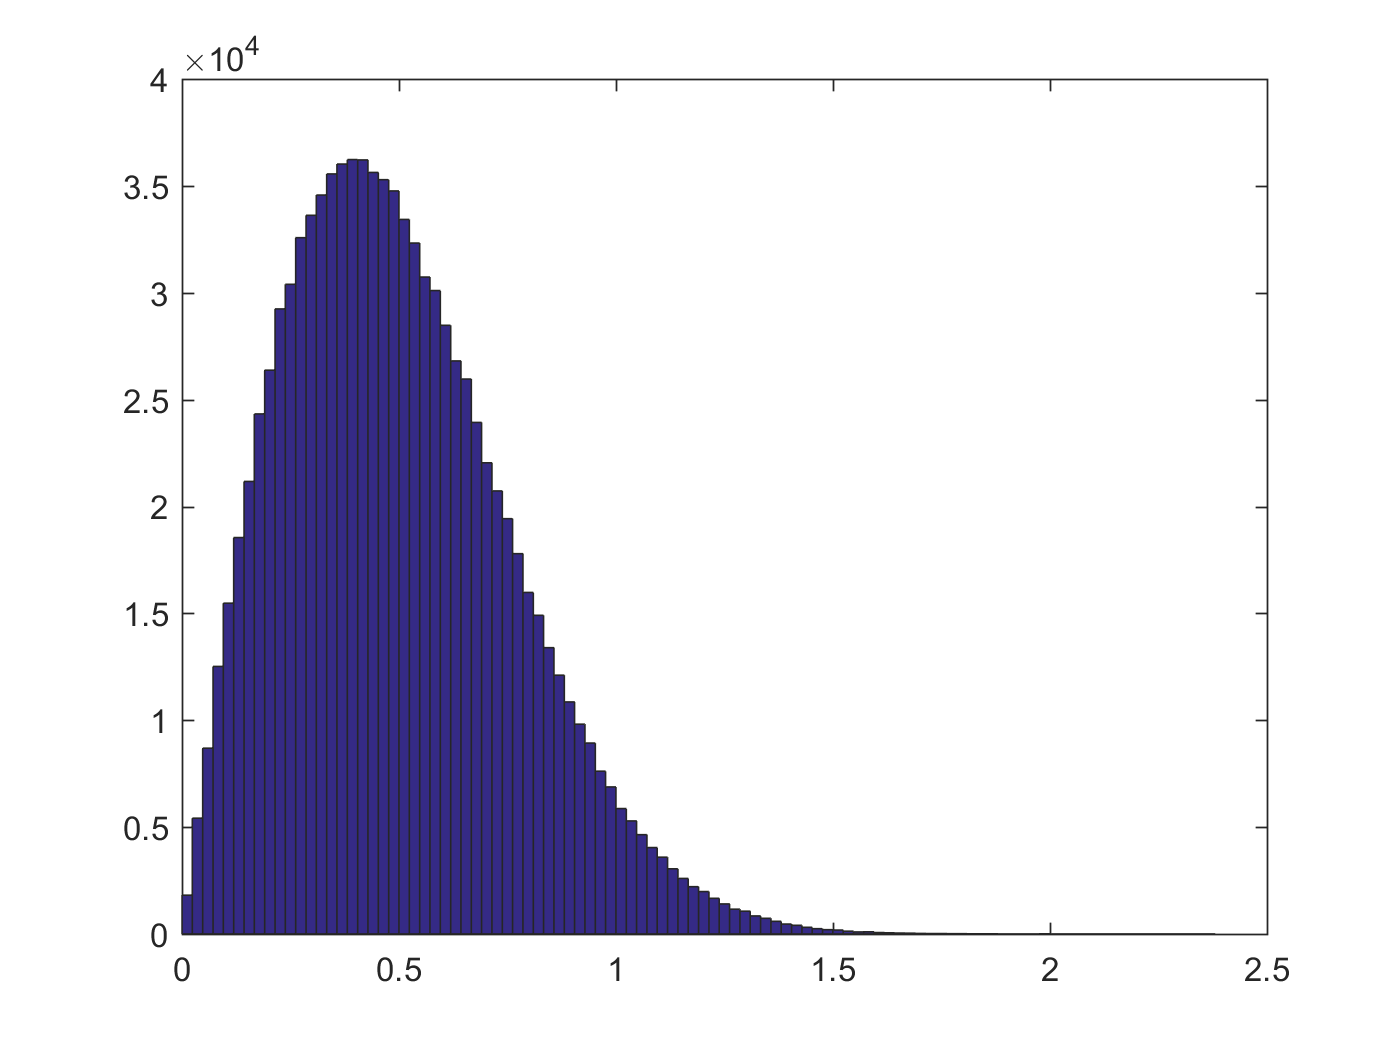
Consider the following process: sample $n$ points uniformly at random in the unit square, and for each point $i$, let $d_i$ be the distance from $i$ to its nearest neighbor. Finally, let $z_i = d_i\sqrt{n}$. My question is, what is known about the limiting distribution for the $z_i$'s as $n\to\infty$? Here is a histogram for $n=10^6$:

Nearest neighbor distribution

I am most interested in the first-order behavior near $z=0$. It looks like we have $f(z) \approx 0.14z$ or thereabouts but for all I know it might not even be linear.

$\endgroup$
4
  • 3
    $\begingroup$ What's the maximum, $\sqrt 2$? Looks like $>1.5$ in the figure $\endgroup$ Commented Aug 26, 2018 at 22:48
  • $\begingroup$ Square root of exponential? $\endgroup$ Commented Aug 27, 2018 at 0:18
  • $\begingroup$ If points are distributed according to a Poisson process with intensity 1, the probability that a point has no neighbor in distance $r$ is $e^{-\pi r^2}$. $\endgroup$ Commented Aug 27, 2018 at 0:20
  • $\begingroup$ @BjørnKjos-Hanssen the maximum is actually $\sqrt{2n}$ because I scaled the nearest-neighbor distances by $\sqrt{n}$. The distribution just has a small tail. $\endgroup$ Commented Aug 27, 2018 at 2:36

1 Answer 1

6
$\begingroup$

If $n$ points are placed uniformly at random in the unit square, then the distribution is very close to a Poisson process with intensity $n$. Scaling the process by $\sqrt n$, it’s like a Poisson process with intensity 1. Conditioning a Poisson Process on the existence of a point at $x$, the remainder of the process is a Poisson process with the same intensity.

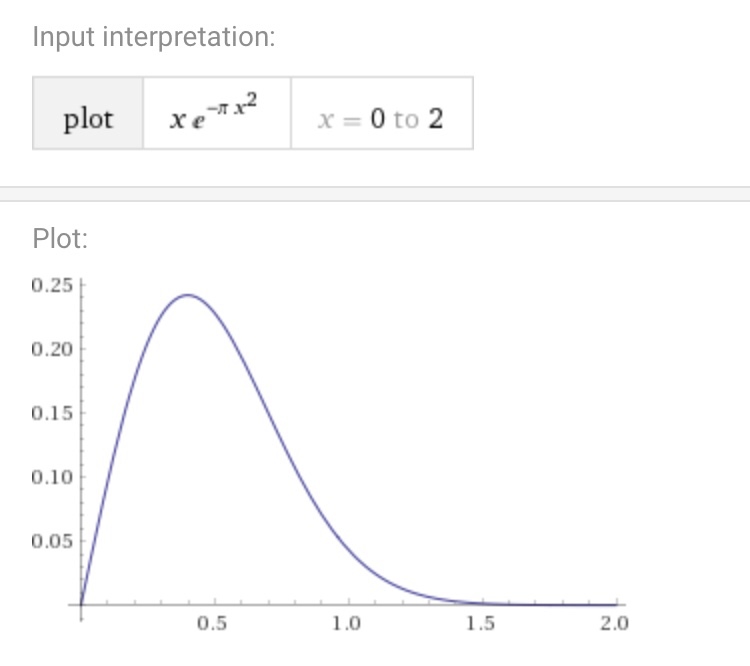
The probability that the nearest neighbor is more than $r$ away is the probability that a Poisson random variable with mean $\pi r^2$ takes the value 0, that is $e^{-\pi r^2}$. Differentiating, we see the density (which appears in your graph) is $2\pi re^{-\pi r^2}$.

The graph of this per wolfram alpha: enter image description here

$\endgroup$
4
  • $\begingroup$ I see, is there a standard way to resolve the dependency between the samples? In other words, I understand that if I choose a single point and look at the nearest neighbor distance, I get the function you wrote, but does the fact that I took the nearest-neighbor distances from all $n$ points change anything? $\endgroup$ Commented Aug 27, 2018 at 2:33
  • 1
    $\begingroup$ The dependency between points went away when I moved from having exactly $n$ points in the square to a Poisson process with intensity $n$ in the square. This is a very mild change. Things got even better when I moved to a Poisson process with intensity $n$ in the plane as that made the edge effects go away. $\endgroup$ Commented Aug 27, 2018 at 2:47
  • $\begingroup$ Sorry, this is kind of unfamiliar territory for me. What I meant was, when I built my histogram, I sampled $n$ points and did a histogram of each of their nearest-neighbor distances. I'm having difficulty resolving the fact that those $n$ distances are dependent, and I think they continue to be dependent even if we take the Poisson process approximation, no? $\endgroup$ Commented Aug 27, 2018 at 4:05
  • 1
    $\begingroup$ I see. Yes they are dependent in a single realization (=choice of points). For example if you take the closest pair of points, then the mutual distance is the minimum distance for both of them. But: since you are taking a large number of points, what you are really looking at is the distribution of the nearest neighbour distance from a single point. (This is essentially the strong law of large numbers: the number of points for which the nearest point is at distance in the range $[a/\sqrt n,b/\sqrt n]$ is $n$ times the probability that a single point has nearest point in that range). $\endgroup$ Commented Aug 27, 2018 at 5:29

You must log in to answer this question.

Not the answer you're looking for? Browse other questions tagged .