The below is motivated by a problem I'm observing in my experimental data
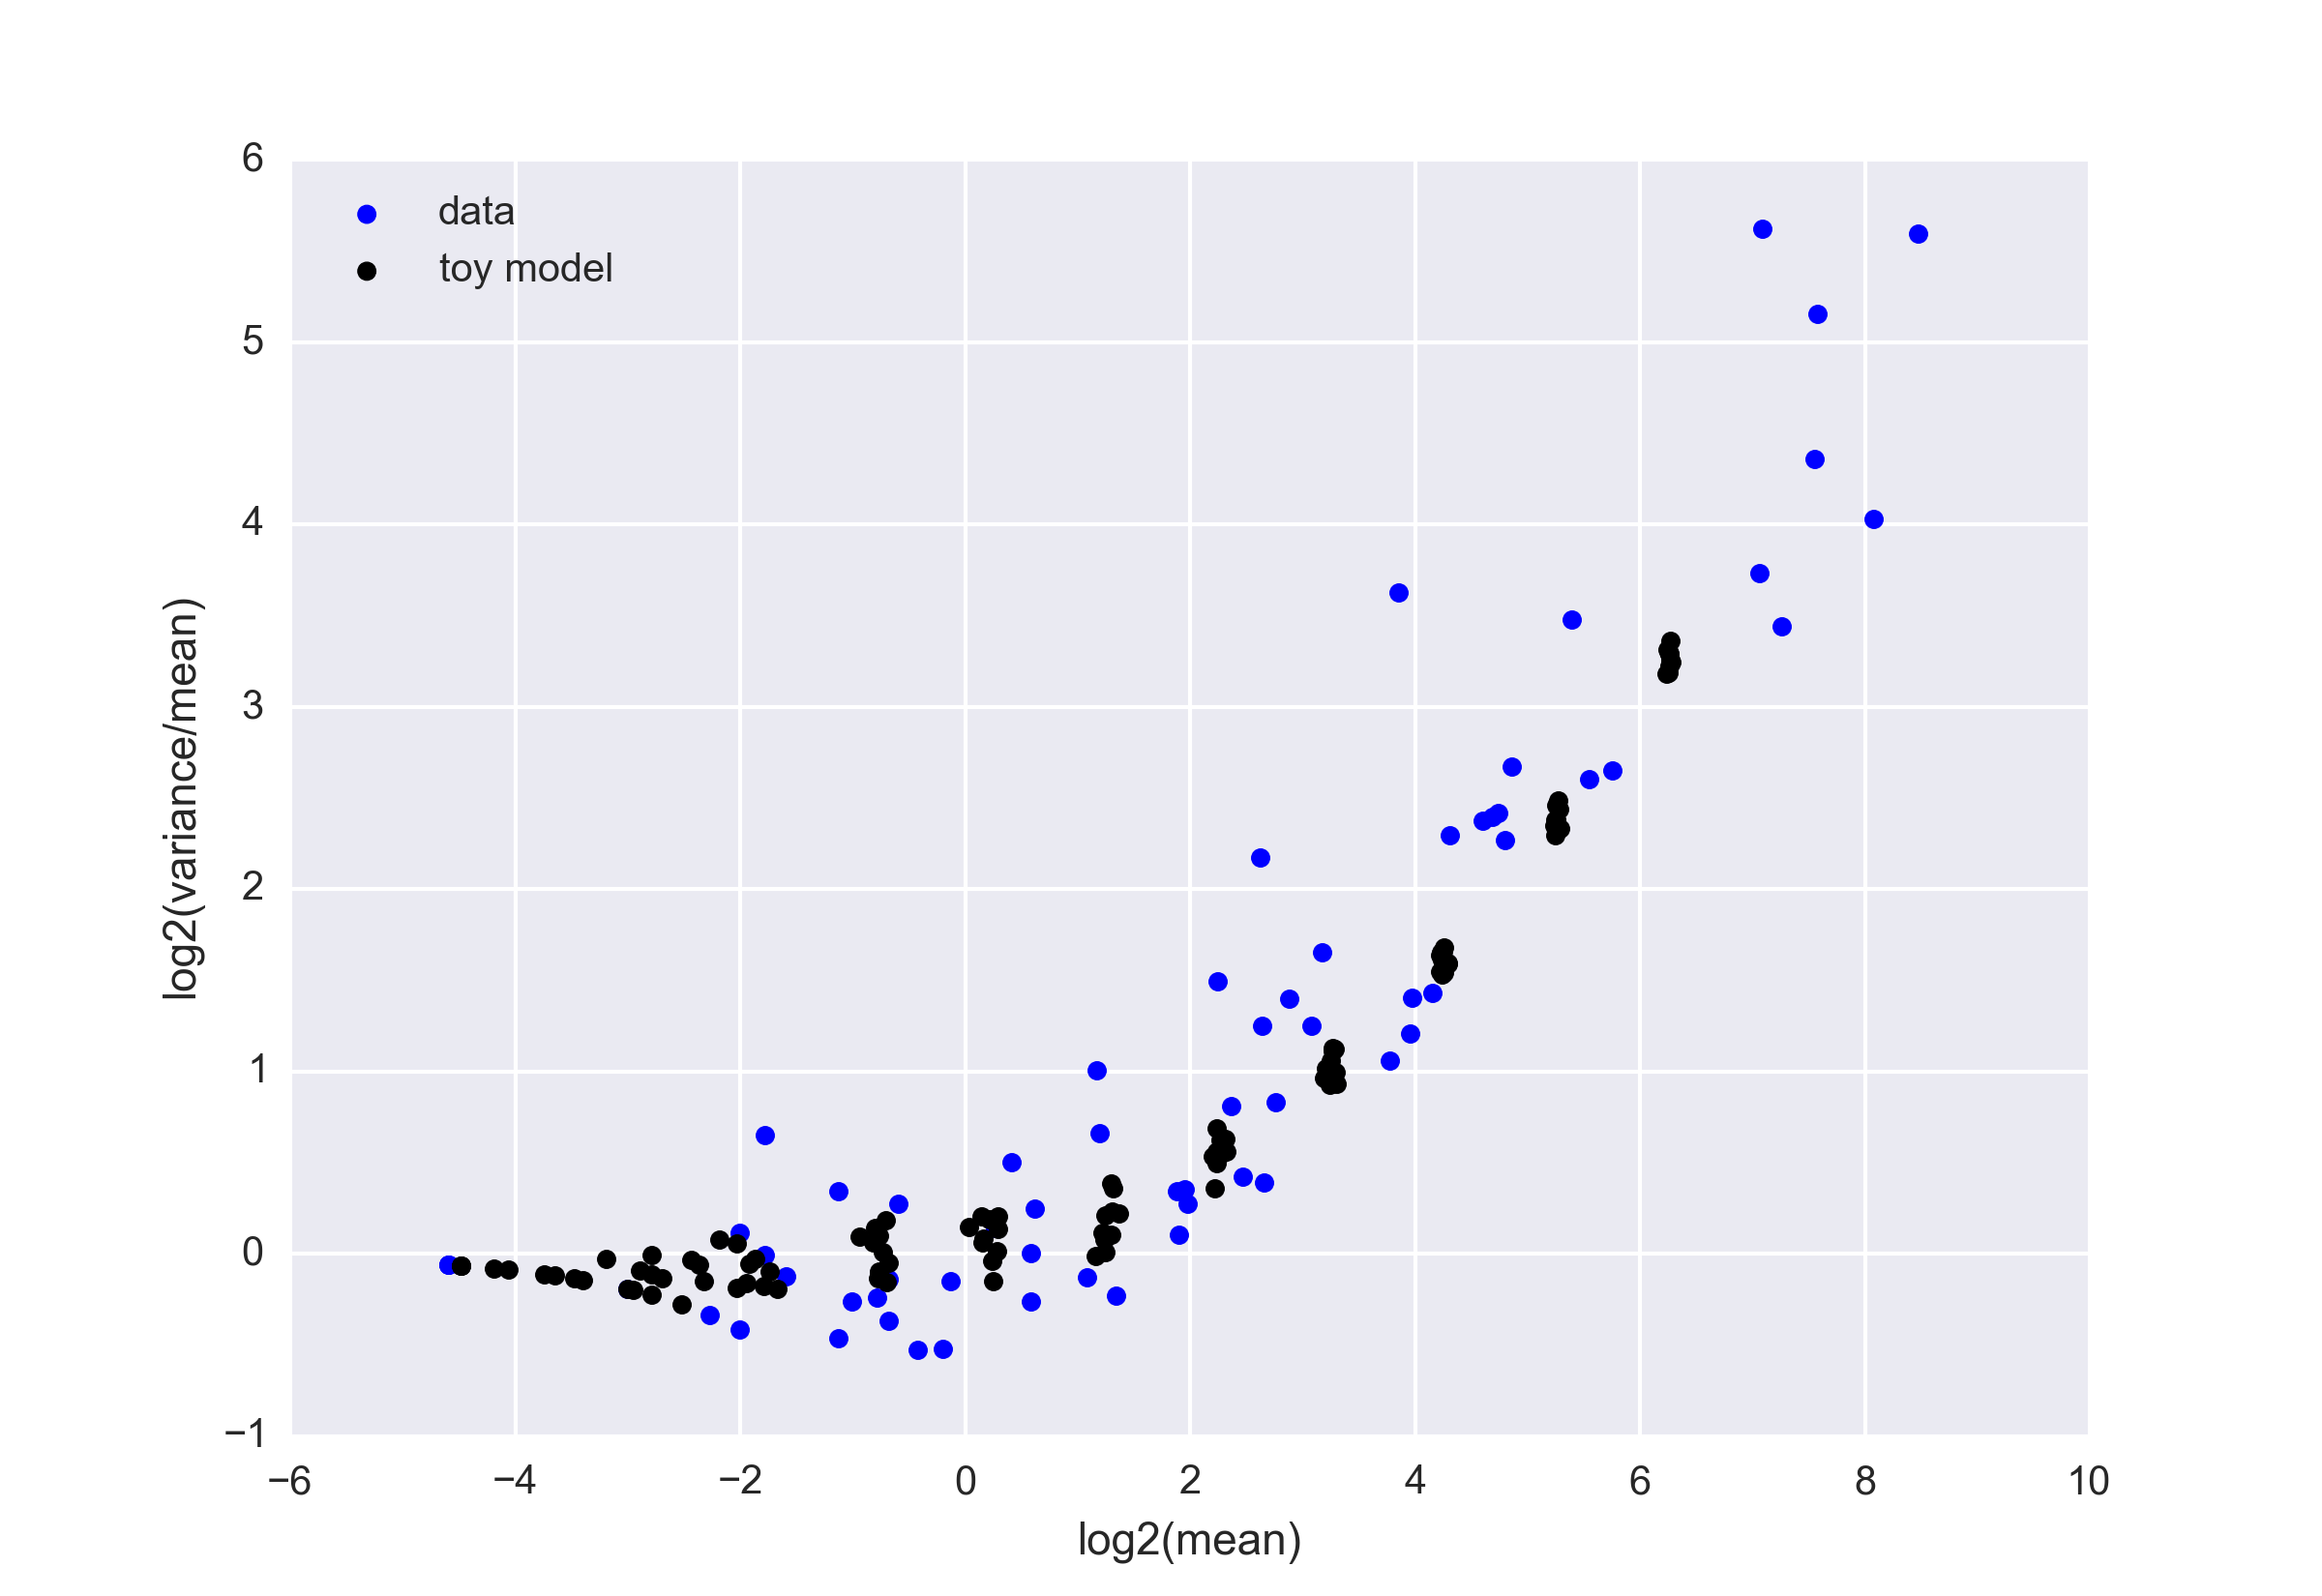
I have m boxes, where each box is supposed to contain k molecules of mRNA. The measurement process includes labeling all the molecules with a box-specific tag, mixing them, amplifying them to detectable levels and deconvoluting based on tags. As tag-labeling is a lossy process with estimated efficiency of 5-10% and as we are essentially counting successes a binomial model with n=k and 0.05<=p<=0.1 sounds fitting. Graphing the variance/mean vs. mean shows that it doesn't fit to the straight line expected from a binomial with constant p. If we assume that p is variable, however, things work out well. (see bottom for data)
The intuition is that we are compounding distributions - as an example assume that m/2 boxes are sampled with p=0.05 and m/2 boxes with p=0.1. Then the distribution of all m boxes would be an 'overlap' of 2 binomials each with the same n but different p. Intuitively I would expect the mean to be bound between the mean of the two distributions (as the mean is a point found between the two other points) while I would expect the variance to be larger than either of the two variances (as variance is correlated with the width of the distribution and the 'overlapping' width is by definition longer than each of its components). Simulations support my argument but I don't know how to go about formalizing it and I don't know how to use this to assist is modeling the data. (Esp - how to use this to estimate the variability in tagging efficiency).
What do you say?
The below graph shows real data (each point is generated from 48 boxes with equal k) versus the toy model suggested above (100 boxes with p=0.05 and 100 boxes with p=0.1 for different n).
[EDIT: per comments 'concatenated distribution' was changed to 'compound distribution']

