This question concerns mathematical modelling of the citation curve, well-known in the sciencemetry.
The citation curve (or else the $h$-curve) of an individual researcher is the vector $(c_1,c_2,\dots,c_n)$ whose length $n$ is equal to the number of papers written by the researcher and $c_i$ is the number of citations of the $i$-th paper. The papers are sorted in decreasing order of citations, so that the sequence $(c_1,\dots,c_n)$ is non-increasing. The h-index of the researcher is the largest number $i$ such that $c_i\ge i$.
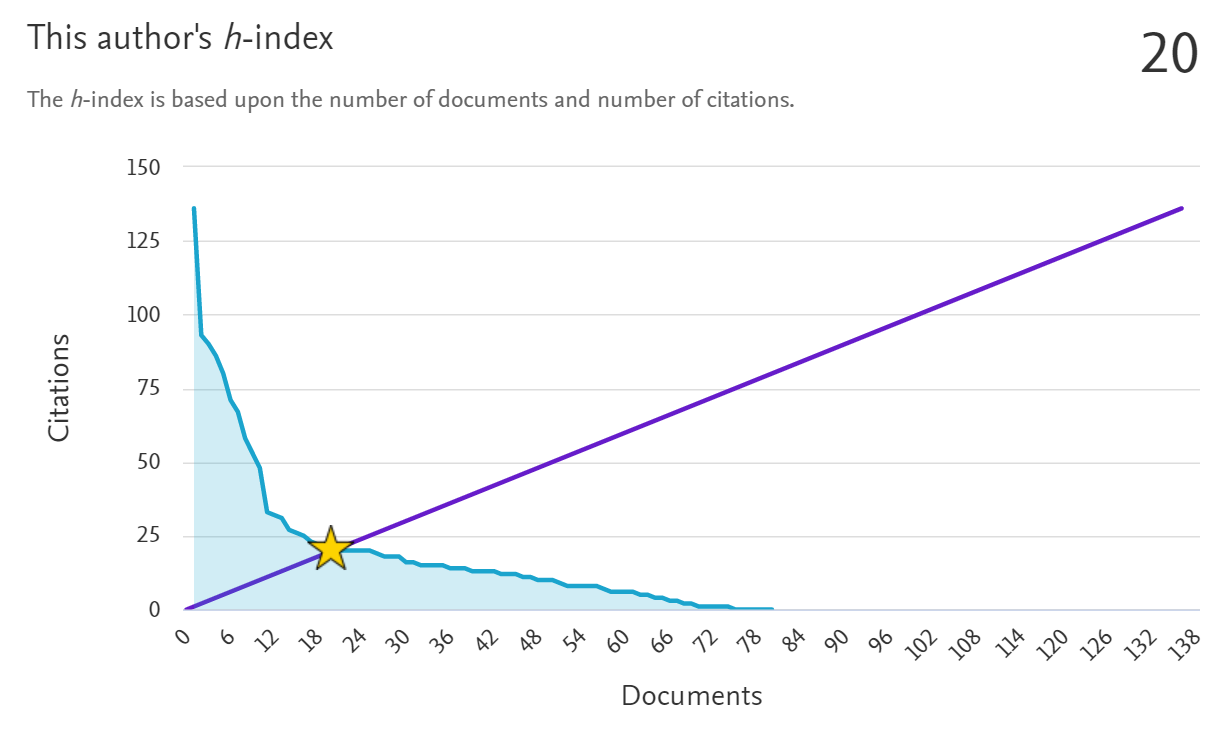
Looking at concrete $h$-curves (for example, of Fields medalists), one can observe that such curves have a form resembling the hyperbola $y=a/x$ where $a$ is the square of the $h$-index.
Is there any reasonable mathematical model desribing the ideal h-curve, which agrees with empiric data?
If yes, then is this h-curve indeed close to the hyperbola? Or maybe to the exponential function $y=a^x$ for some $a<1$?
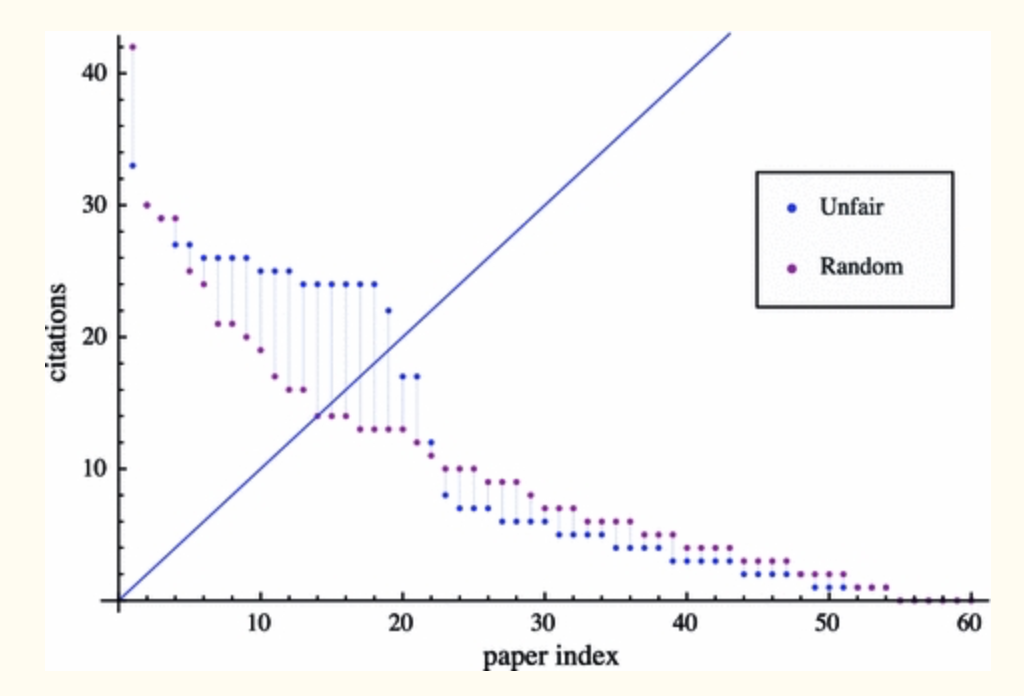
I am interested in such a question because of known problems manipulability by h-index. For example, if one writes papers and in each next paper cites all his previos papers, then the h-curve becames linear (described by the equation $y=2h-x$), so is easily distinguishable from ideal "hyperbolic" curves. But is there any sientific justification of the "hyperbolicity" of a non-manipulable h-curve?
In some countries (including mine) the h-index becomes to be am important characteristic of a researcher, which influences decisions concerning grants, promotions etc. So, there are temptations of manipulating with this index. How can one reveal such manipulations? I think that analysis the geometry of the h-curve can be of some help.
For example this
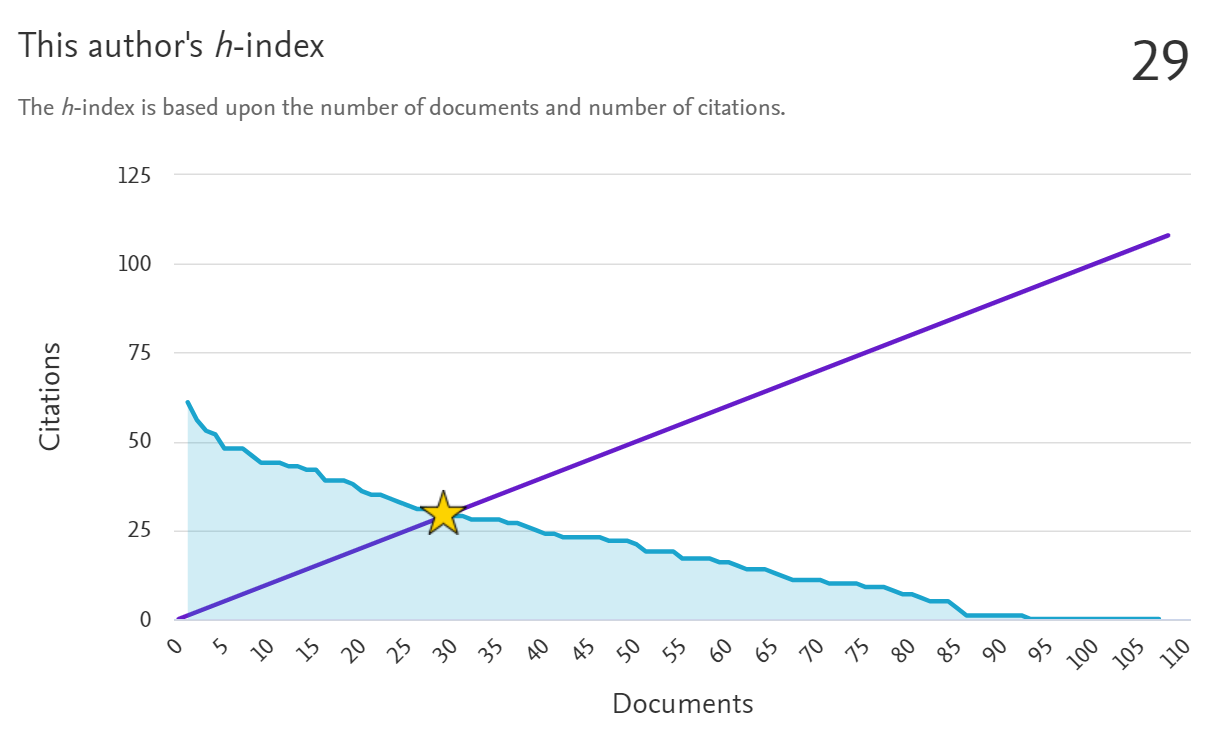
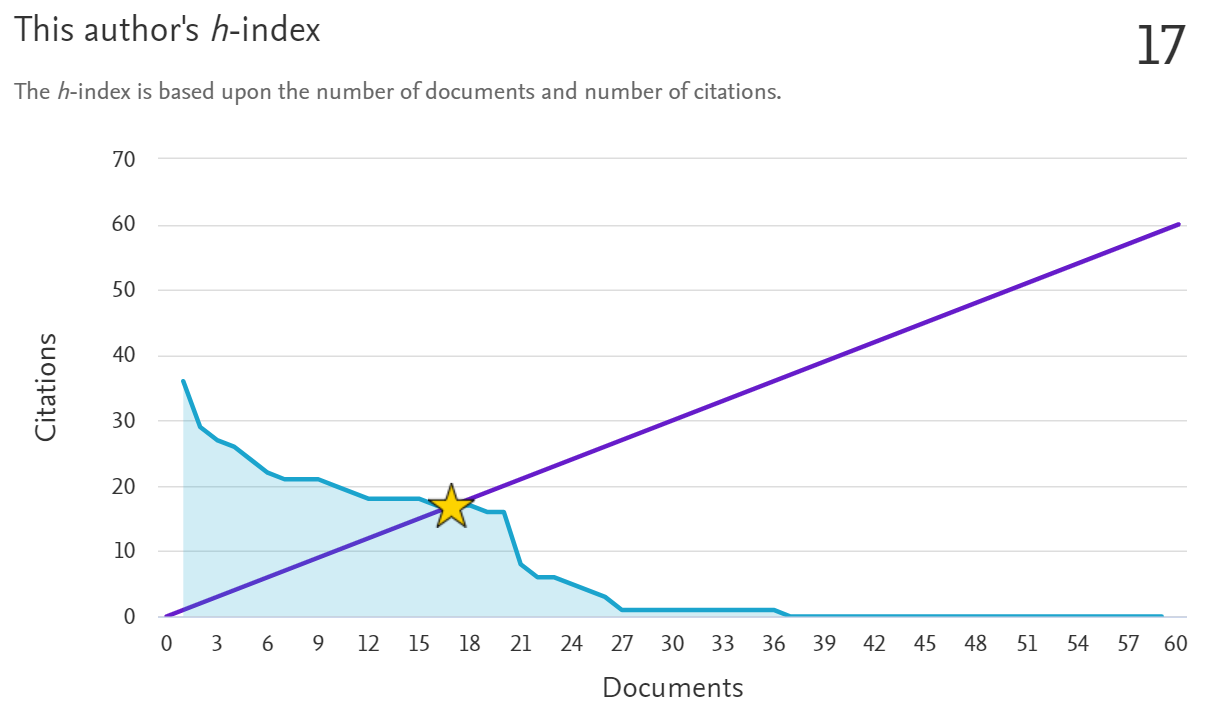
is the h-curve of one of Fileds medalists, and the next two could witness about some manipulations (all data are taken from Scopus):


