This question concerns the behavior of a function $f(\;)$ that maps each number in $\mathbb{N}$ to its mean prime factor. I previously posted premature questions, now deleted, which explains the cites below to several who contributed observations. Also, the question, "Distribution of the number of prime factors," may be relevant.
Define $f(n)$ to be the floor of the geometric mean of all the prime factors of $n$. For example, $$n = 6500 = 2^2 \cdot 5^3 \cdot 13 = 2 \cdot 2 \cdot 5 \cdot 5 \cdot 5 \cdot 13 \;.$$ $$f(6500) = \lfloor\left( 2 \cdot 2 \cdot 5 \cdot 5 \cdot 5 \cdot 13 \right)^{\frac{1}{6}}\rfloor = \lfloor 4.32 \rfloor = 4 \;. $$ For $n$ a prime, $f(n) = n$, i.e., the primes are fixed points of $f(\;)$. For $n$ a prime power $p^k$, $f(n)=p$ (as Julian Rosen observed). Greg Martin noted that $$ f(n) = \lfloor n ^ {1/\Omega(n)} \rfloor $$ where $\Omega(n)$ is the number of primes dividing $n$ counted with multiplicity.
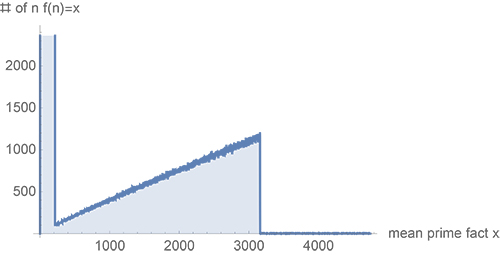
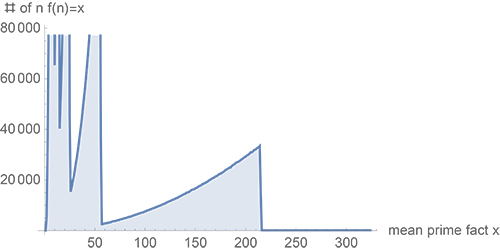
I explored $|f^{-1}(k)|$, the number of $n \in \mathbb{N}$ that map to $k$: $f(n)=k$. The root transition points are crucial (as Gerhard Paseman emphasized). For $n_\max=10^7$, the square-root, cube-root, and fourth-roots of $n_\max$ are $(3163,216,57)$ rounded up. Here are graphs of $|f^{-1}|$ at two scales:

$n_\max=10^7$. Note the transitions at $216$ and $3163$.

$n_\max=10^7$. Note the transitions at $57$ and at $216$.
Q. What explains the apparent linearity in the first graph in the range $[216,3163]$, in contrast to the gradual upsweep in the range $[57,216]$ in the second graph?
I did not expect to see such regularity...
