19
$\begingroup$

I have recently started to read a bit about geometry and topology. Hopf fibration, Lense spaces, CW complexes, stuff that are discussed in Hatcher's Algebraic Topology and other things that require good visualization. What is apparent to me is that the further I go, the less I understand what is going on. I have searched on YouTube and found some really nice animations for some of these topics but good animations are rare like gems.

Advanced stuff in mathematics are less discussed and available on the internet. I have realized that if I want to understand math one day, at some point I should be able to create my own animations. Now, my question is rather directed at people with experience in teaching advanced mathematics or currently doing research in mathematics in areas where geometric intuition is absolutely necessary. What kind of tools do you use? Do you develop them on your own in your research team/group? Can an independent person have access to them? Is it possible for an independent person to develop this kind of tools on their own?

Can you think of a situation where you couldn't understand a geometric concept visually but you created an animation that demystified it for you?

$\endgroup$
6
  • 1
    $\begingroup$ you mean Hatcher's Algebraic topology $\endgroup$ Commented Aug 8, 2018 at 16:39
  • 2
    $\begingroup$ @PraphullaKoushik Yeah. Freudian slip. I'm still recovering from a recent truly bad encounter with algebraic geometry. $\endgroup$ Commented Aug 8, 2018 at 16:47
  • 1
    $\begingroup$ There are some pretty interesting tools for 3-manifolds. Like regina-normal.github.io $\endgroup$
    – JJJ
    Commented Aug 8, 2018 at 17:49
  • 5
    $\begingroup$ What is apparent to me is that the further I go, the less I understand what is going on. ObVonNeumann: "Young [one], in mathematics you don't understand things. You just get used to them." And while visualizations are useful, you might find that mathematicians are less reliant on them than you might guess. Another not-really-joke that's relevant here: Student: How do you visualize 6-dimensional space? Teacher: Oh, it's easy, you just visualize $n$-dimensional space and then set $n=6$. $\endgroup$ Commented Aug 8, 2018 at 18:10
  • 7
    $\begingroup$ At some point, especially in higher dimensions, visualization can be misleading, In low dimensions (2, 3) it can help. Its best that you get a rudimentary intuition by working out a couple of examples and use that to guide you in more general situation. $\endgroup$ Commented Aug 8, 2018 at 20:07

3 Answers 3

14
$\begingroup$

Here is one case study:

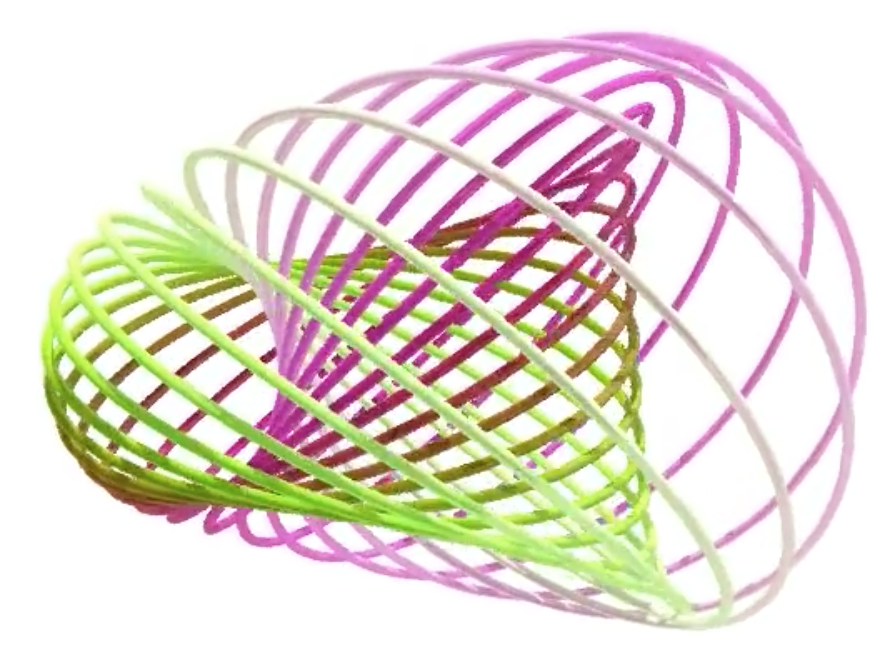
An impressive animation of the Hopf fibration created by Niles Johnson using only open-source tools, available for all platforms: The Python-based mathematics program Sage was used for determining the fiber parametrizations and keeping track of all the animation data. Sage provides an interface to the ray tracing system Tachyon, which produced the individual frames. These were then stitched into an animation using FFmpeg.

$\endgroup$
4
  • $\begingroup$ This is very useful. Thanks. SAGE also seems to have a relatively active community of users. I'll give it a try. But if I understood correctly, SAGE itself doesn't produce animations. I need to stitch the frames together with another software (FFmpeg for example). Am I right? $\endgroup$ Commented Aug 9, 2018 at 22:09
  • 1
    $\begingroup$ indeed; Mathematica is more capable, but it is not open source. $\endgroup$ Commented Aug 9, 2018 at 22:10
  • $\begingroup$ Thanks. I'm afraid I do not understand what Tachyon does in this scenario exactly. Is it even necessary? I checked the website but couldn't make heads or tails out of it. $\endgroup$ Commented Aug 9, 2018 at 22:13
  • 1
    $\begingroup$ Tachyon is a ray tracing program, meaning that it adds shades and lights to the image so that it looks as if it is a photograph of a 3D object; it is not essential, but without it the animation would not look as pretty. $\endgroup$ Commented Aug 10, 2018 at 6:19
9
$\begingroup$

SnapPy is a widely used program within the geometric topology community for studying hyperbolic structures on $3$-manifolds.

Here is a YouTube video of Nathan Dunfield showing off some of SnapPy's functionality (creating Dirichlet domains, showing how to visualize the cusps, etc).

$\endgroup$
1
  • $\begingroup$ This is very cool. Thanks for sharing. $\endgroup$ Commented Aug 9, 2018 at 22:11
1
$\begingroup$

Nate Eldredge's comment is the one to take on board. Imagine a square 2" wide. Draw a circle of radius 1" at each corner. In the middle you can draw a circle touching all four circles, whose radius you can no doubt work out. In three dimensions do the same with spheres at the corners of a cube 2" wide: you get a sphere in the middle touching them all. Now what about N dimensions? The central hypersphere touching all 2^N hyperspheres at the corners of the hypercube actually sticks out, outside the hypercube when N > 4. Your 3-D imagination is little help here.

$\endgroup$
2
  • $\begingroup$ for N=4, your procedure produces a beautiful, dense, sphere packing of R^4, with each sphere toughing 24 other spheres. [The procedure I'm referring to is the following: place spheres centred at the 0-cells of the standard cubulation of R^4 by 4-cubes + spheres at centred at the centers of the 0-cells]. The resulting lattice (formed by the centers of the spheres) is called the $D_4$ lattice, and has quite a larger symmetry group than the group initially visible from the construction I provided. $\endgroup$ Commented Jul 11 at 16:24
  • $\begingroup$ See here also: mathoverflow.net/a/128881/10503 $\endgroup$ Commented Jul 11 at 20:43

You must log in to answer this question.

Not the answer you're looking for? Browse other questions tagged .