See update at the bottom.
Here the brackets represent the fractional part, and $\alpha \in [0, 1]$ is a positive irrational number. It is well known that the sequences $\{n\alpha\}$, $\{n^2\alpha\}$ and more generally $\{n^p\alpha\}$ (with $p$ a strictly positive integer) are equidistributed modulo $1$. It is also well known that $\{2^n\alpha\}$ is equidistributed for almost all $\alpha$, indeed for all $\alpha$ that are normal numbers. Also these sequences are dense in $[0,1]$ with a uniform distribution on $[0, 1]$. But they are far from random: they are typically auto-correlated.
If $p$ is large enough (higher than $2$?), do we have $\rho_k=0$ ($k=1,2,\dots$) for the sequence $x_n=\{n^p\alpha\}$, indexed by $n$? Is the sequence truly random-like? It passes a few statistical tests, but fails at the gap test (described in the appendix), unless maybe if $p>3$. I defined random-like in the appendix.
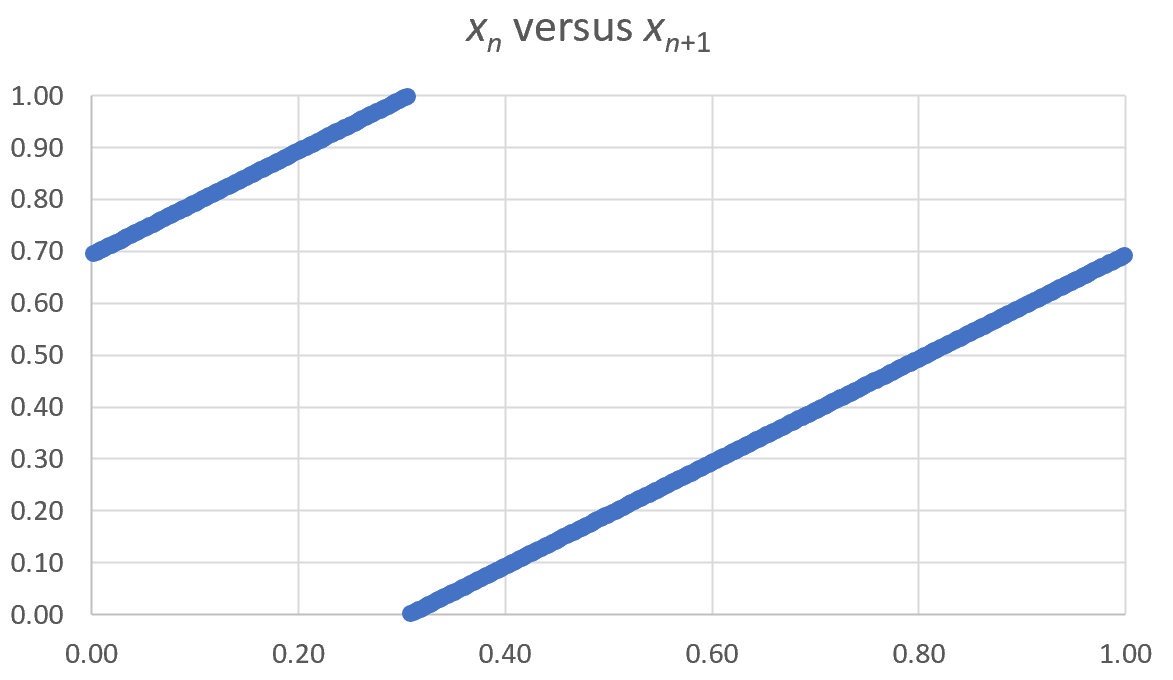
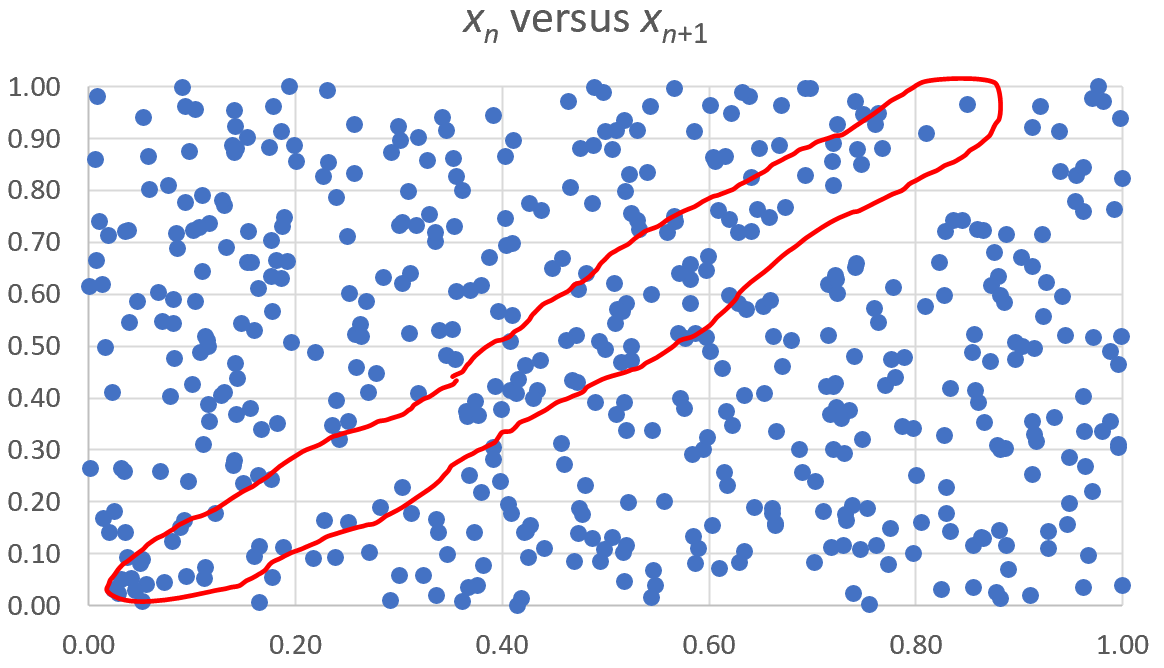
Even more striking, if $p$ is irrational (say $p=\sqrt{7}$) and $\alpha=1$, it seems that the sequence is not only equidistributed (a well known fact if I remember correctly) but also perfectly random-like and can be used for pseudo-random number generation. Not only all auto-correlations are equal to zero (it seems), but it passes the gap test and some basic independence test that I tried. See scatterplots below, where the point $(x_n,x_{n+1})$ represents respectively terms number $n$ and $n+1$ in the sequence.
The first scatterplot is for $p=\sqrt{7},\alpha=1$ and it suggests independence between two successive terms of the sequence. The second scatterplot is for $p=1, \alpha=\log 2$ and it shows total lack of independence between two successive terms of the sequence. The third scatterplot is for $p=1.4,\alpha=\log 2$: the red band shows an area of non-randomness; it looks much better if $\log 2$ is replaced by $\sqrt{2}/2$. Some parameters (not pictured here) create their own problems: for instance, $p=1.5, \alpha=\sqrt{2}/2$ results in $x_n=0$ for $n=2,8,18, 32,50, 72,\dots$
Note the X-axis represents $x_n$ and the Y-axis represents $x_{n+1}$.


The gap test (some people may call it run test) proceeds as follows. Let us define the binary digit $d_n$ as $d_n=\lfloor 2x_n\rfloor$. Say $d_n=0$ and $d_{n+1}=1$ for a specific $n$. If $d_n$ is followed by $G$ successive digits $d_{n+1},\dots,d_{n+G}$ all equal to $1$ and then $d_{n+G+1}=0$, we have one instance of a gap of length $G$. Compute the empirical distribution of these gaps. Assuming $50\%$ of the digits are $0$ on average, the empirical gap distribution should approximately convergeconverges to a geometric distribution of parameter $\frac{1}{2}$ if the sequence $x_n$ is random-like.
A sequence if random-like if it satisfies the following property. For any finite index family $h_1,\dots,h_k$ and for any $t_1,\dots,t_k\in [0,1]$, we have
$$P(x_{n+h_1}<t_1, \dots, x_{n+h_k}<t_k) =\prod_{j=1}^k P(x_{n+h_j}<t_j).$$
The probabilities are empirical probabilities, that is, based on frequency counts. For instance,
$$P(x_{n+h_1}<t_1, x_{n+h_2}<t_2)=\lim_{m\rightarrow\infty} \Big(\frac{1}{m}\sum_{j=1}^m \chi(x_{j+h_1}<t_1, x_{j+h_2}<t_2)\Big)$$
where $\chi$ is the indicator function.
Update on 11/29/2020
As @Goldstern commented, if $p$ is an integer, the sequence $\{n^p\alpha\}$ can never be perfectly random-like, though randomness might be very closely approached as $p\rightarrow\infty$. So a possible solution is to look at polynomials of infinite degree in $n$ rather than $n^p\alpha$, that is, Taylor series, if one wants to achieve full randomness.
I also replaced the word random by random-like since all these sequences are deterministic, creating some confusion. Initially, I wanted to use the word strongly equidistributed rather than random. I also added the definition of perfectly random-like in the appendix.


