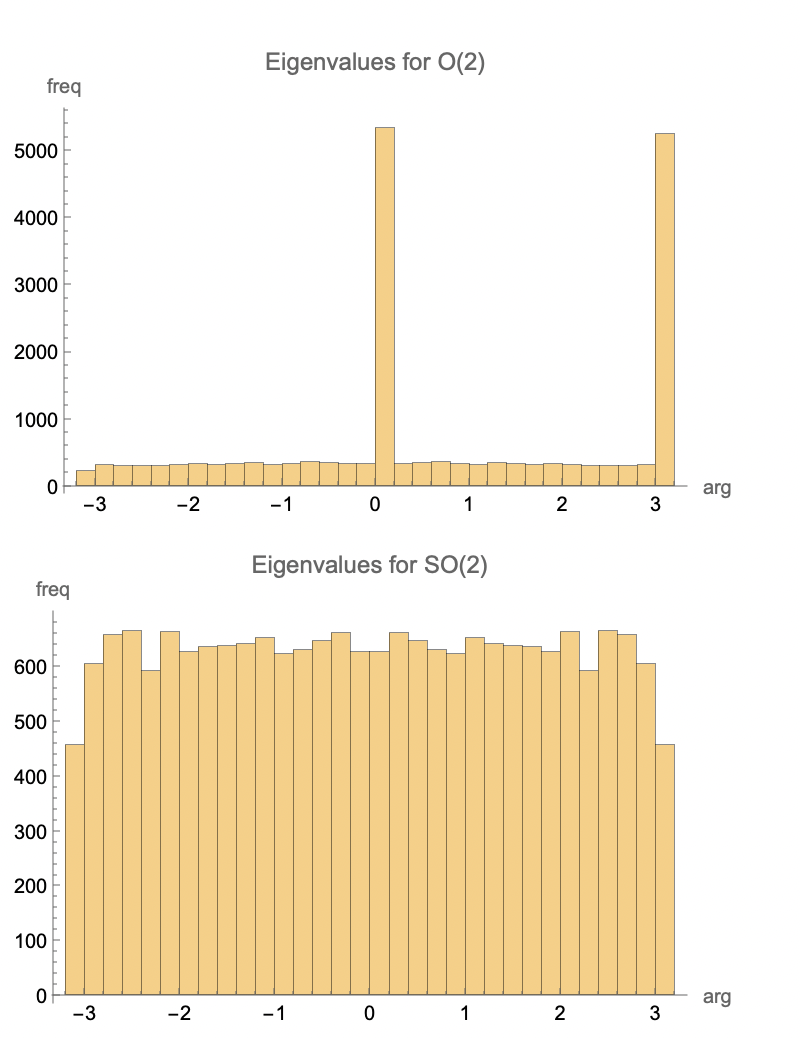
There's an asymmetry because members of O(n) include rotation with random angle and flips with random axis, for $n=2$, the fraction of flips is large, those are $-1,1$ peaks. For larger $n$, bulk of matrices are pure rotations.
Flipping sign of first row makes eigenvalue distribution uniform:
negateFirstRow[A_] := {-A[[1, All]]}~Join~A[[2 ;;, All]];
sampleO[n_] := RandomVariate[CircularRealMatrixDistribution[n]];
sampleSO[n_] :=
  With[{mat = RandomVariate[CircularRealMatrixDistribution[n]]},
   If[Det[mat] > 0, mat, negateFirstRow@mat]];

Histogram[Arg /@ Flatten[Table[Eigenvalues@sampleO@2, {10000}]],
 PlotLabel -> "Eigenvalues for O(2)", AxesLabel -> {"arg", "freq"}]
Histogram[Arg /@ Flatten[Table[Eigenvalues@sampleSO@2, {10000}]],
 PlotLabel -> "Eigenvalues for SO(2)", AxesLabel -> {"arg", "freq"}]

