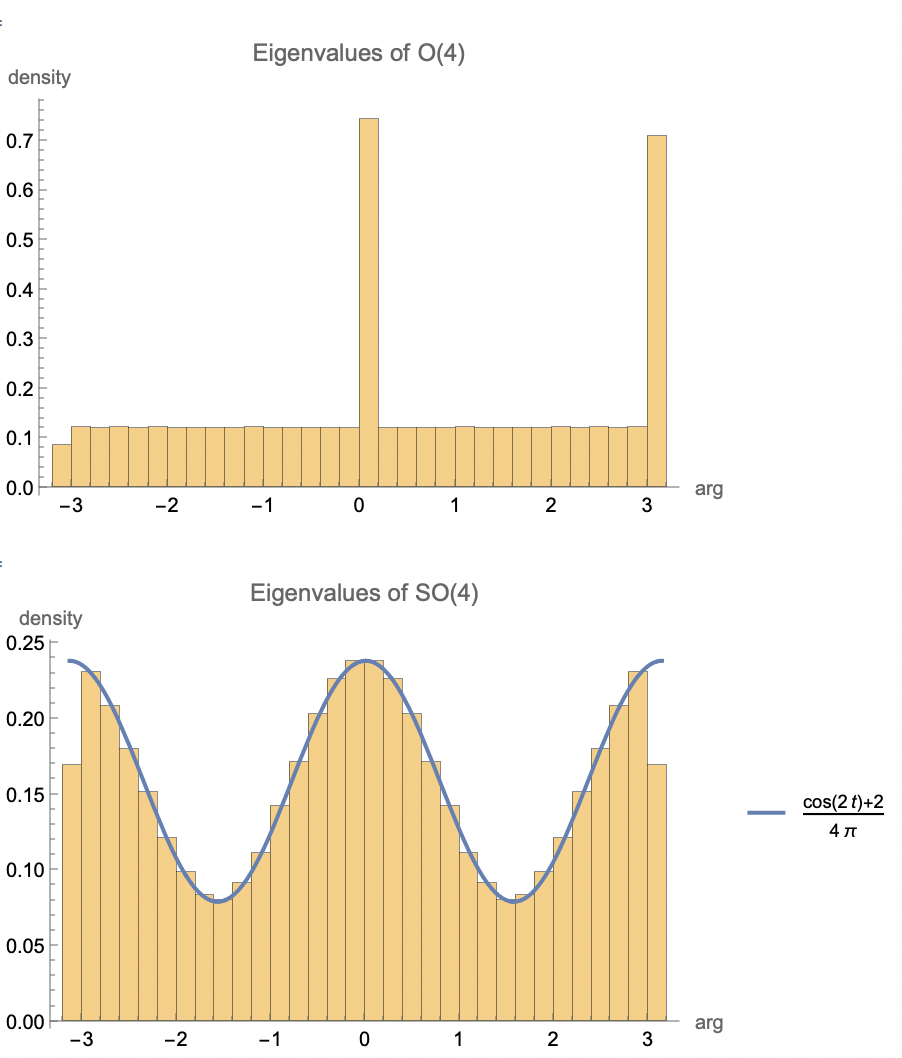
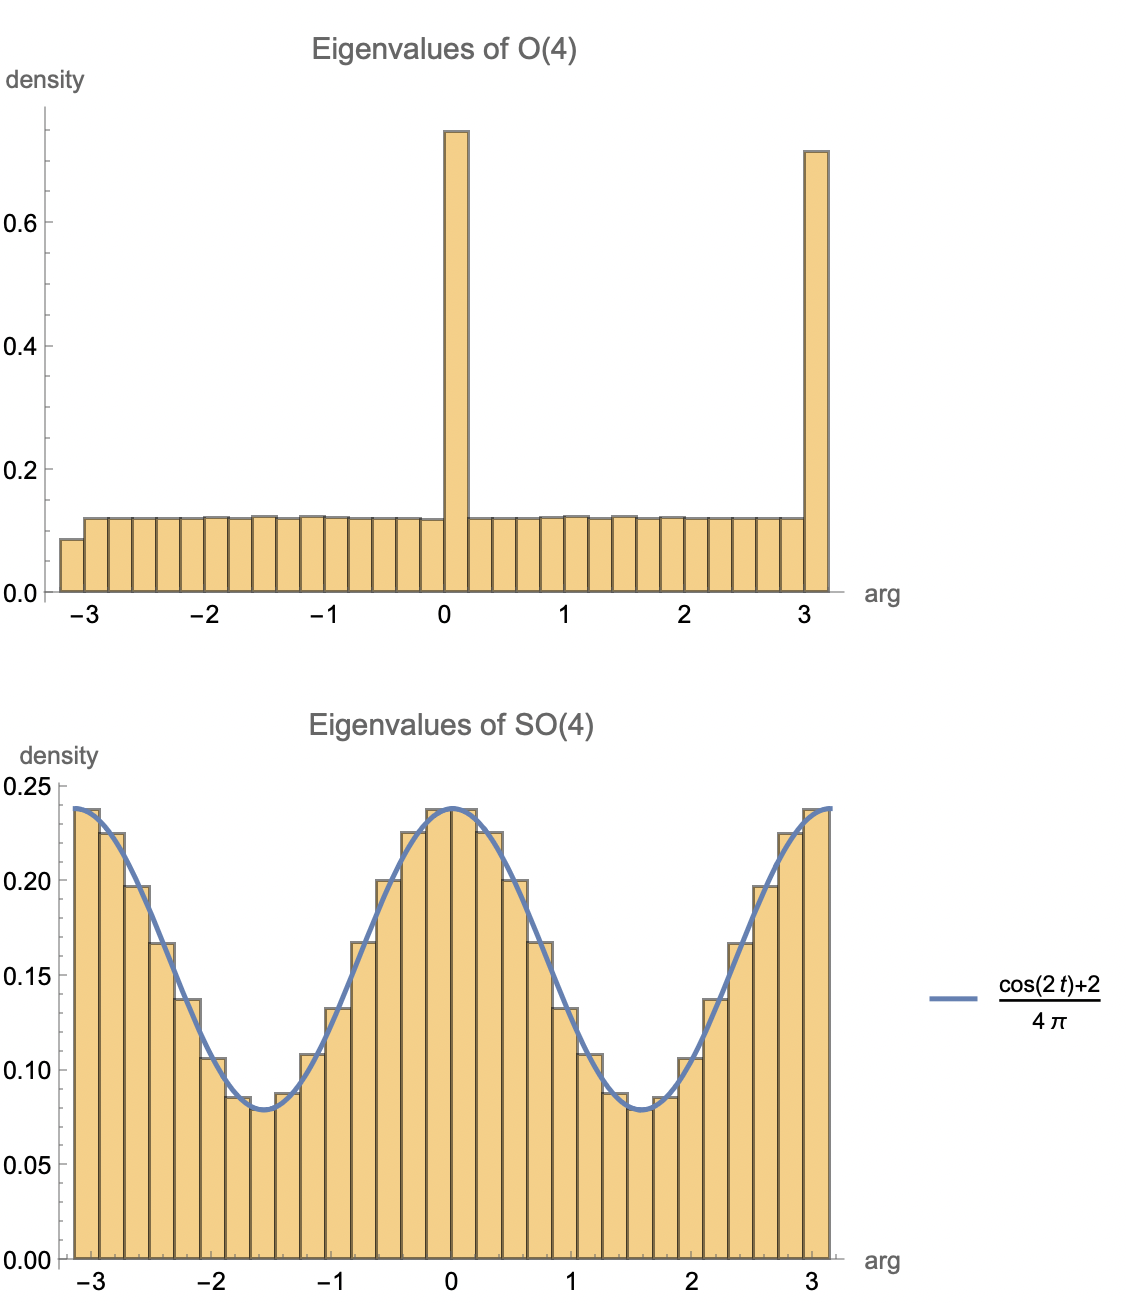
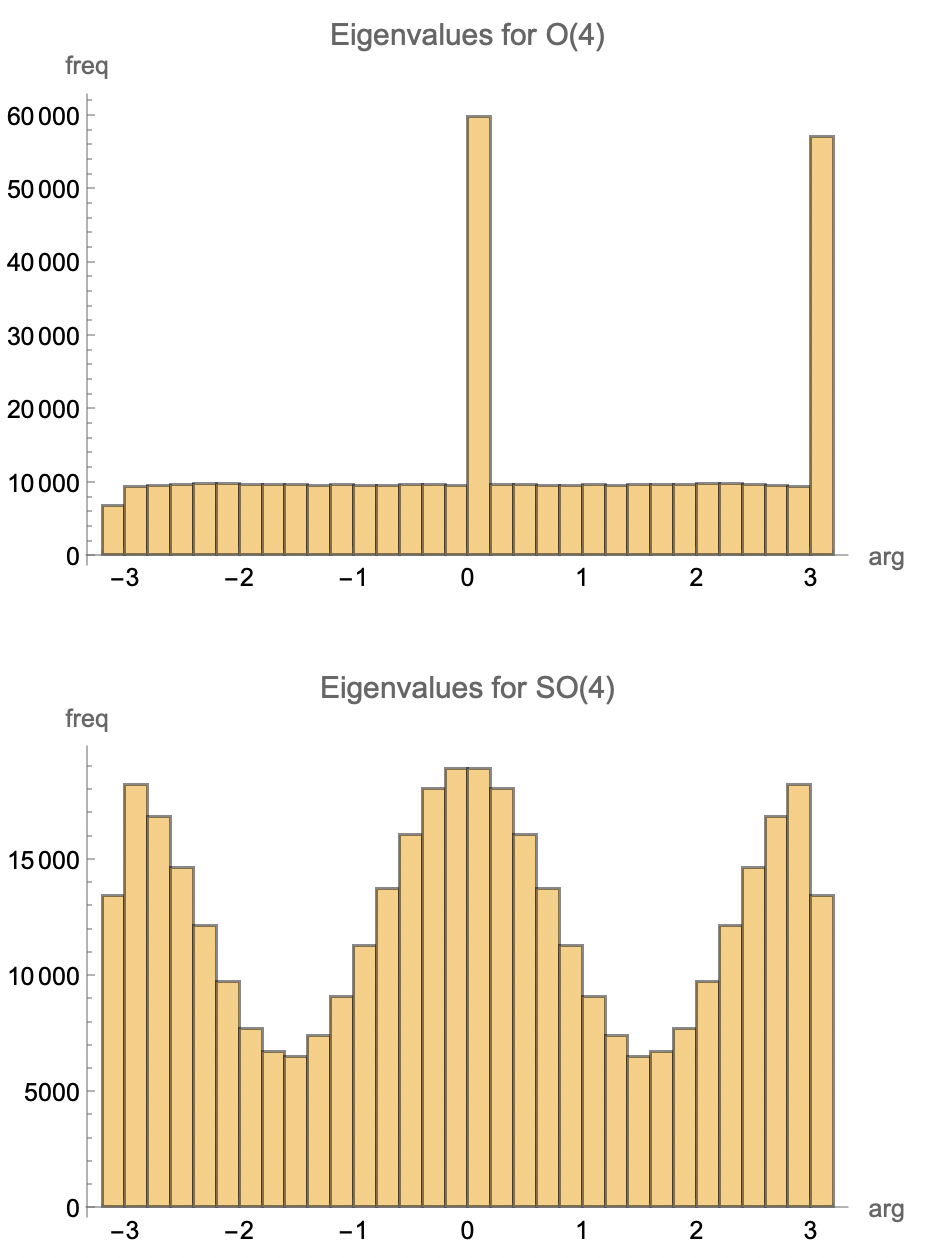
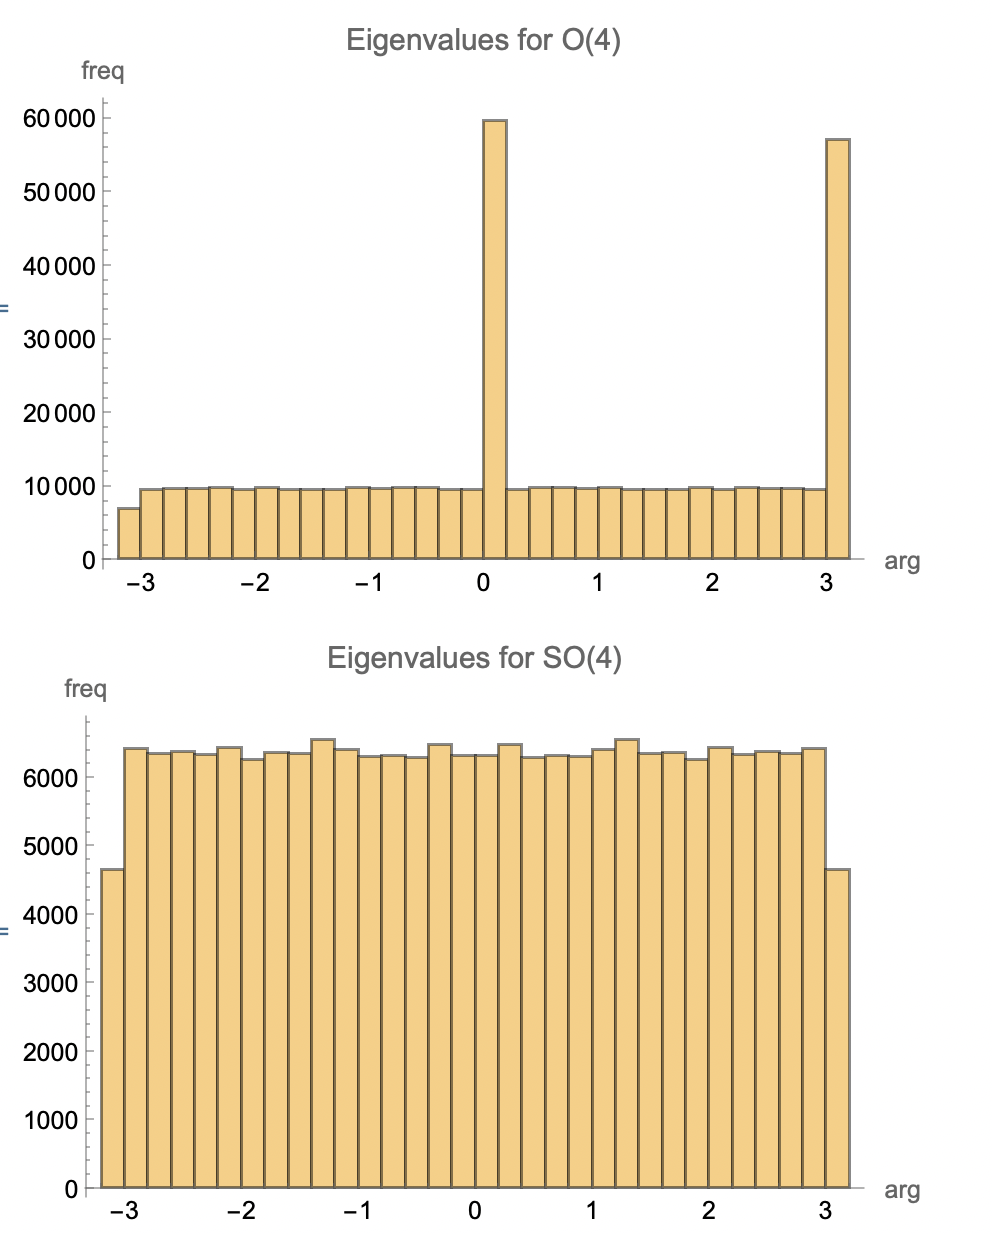
There's an asymmetry because members of O(n) include rotation with random angle and flips with random axis, for small $n$, the fraction of flips is large, which create peaks at $-1$ and $1$ peaks. Restricting to $SO(n)$ removes the peaks at $-1$, and $1$ remaining density follows cosine formula from Girko
negateFirstRow[A_] := {-A[[1, All]]}~Join~A[[2 ;;, All]];
sampleO[n_] := RandomVariate[CircularRealMatrixDistribution[n]];
sampleSO[n_] :=
  With[{mat = sampleO@n}, If[Det[mat] > 0, mat, negateFirstRow@mat]];

n = 4;
numSamples = 100000;
label = StringForm["Eigenvalues of O(``)", n];
angles = Arg /@ Flatten[Table[Eigenvalues@sampleO@n, {numSamples}]];
Histogram[angles, Automatic, PDF, PlotLabel -> label,
 AxesLabel -> {"arg", "density"}]

label = StringForm["Eigenvalues of SO(``)", n];
angles = Arg /@ Flatten[Table[Eigenvalues@sampleSO@n, {numSamples}]];
observedPlot =
  Histogram[angles, Automatic{Pi/15}, PDF, PlotLabel -> label,
   AxesLabel -> {"arg", "density"}];
predictedPlot =
  Plot[(Cos[2 t] + 2)/(4 Pi), {t, -Pi, Pi},
   PlotRange -> {0, 3/(4 Pi)},
   PlotLegends -> {TraditionalForm[(Cos[2 t] + 2)/(4 Pi)]}];
Show[observedPlot, predictedPlot]


