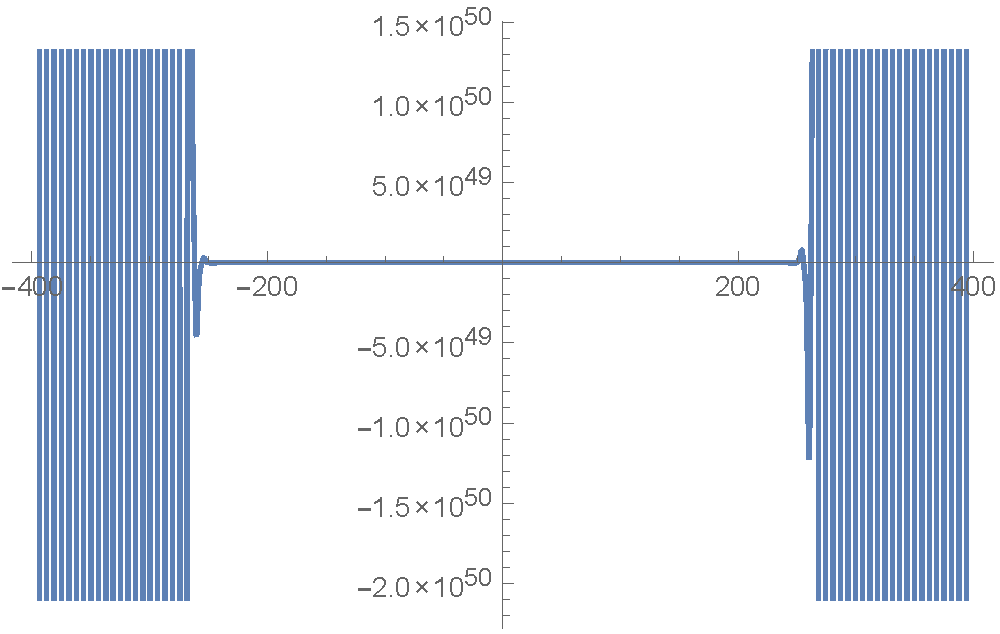
Consider the ODE $y^{\prime \prime}(x) = \cos(x) y(x),$ with boundary value conditions $y(0)=1, y(1)=2.$ Solving it results in a linear combination of Mathieu functions, but what I find more interesting is its graph. So, the question is (a) is there really a phase transition around 300 (b) what is the envelope of the graph (that is, are the maxima/minima growing exponentially, or?) Is the oscillating part actually periodic (which one would guess from the cos term)? And what qualitative methods are there for answering these questions (that is, I am sure the actual Mathieu function has been studied extensively, but just using its specific properties seems too "rigid").

