1
$\begingroup$

Quote Wikipedia: Applications of graphical models include ... gene finding and diagnosis of diseases...

Unfortunately there is no comment what are these applications... Can one comment on this ?

Background

A graphical models is a probabilistic model for which a graph denotes the conditional independence structure between random variables.

The so-called belief propagation is an algorithm for calculations of various probabilities in graphical models. It is used for decoding of error-correcting codes, calculations of free-energy for Ising type model etc. See e.g. the answer to this question: Correlation-Function for Random Graph Ising Model

$\endgroup$
1
  • $\begingroup$ May be it is something like decoding of error-correcting code by belief propagation - gens like bits, genetic diseases are like error in codewords ... $\endgroup$ Commented Apr 23, 2012 at 13:09

3 Answers 3

3
$\begingroup$

Wikipedia is likely referring to examples like the one in the introduction to Koller and Friedman's book. In such examples one forms a directed graphical model with variables for underlying causes of diseases, variables for diseases themselves, and variables for symptoms. These are connected based on which causes could lead to which diseases and which diseases lead to which symptoms, using known data on the conditional probabilities involved. One then takes symptoms as given and, conditioned on these, infers the states of the hidden disease variables.

$\endgroup$
2
$\begingroup$

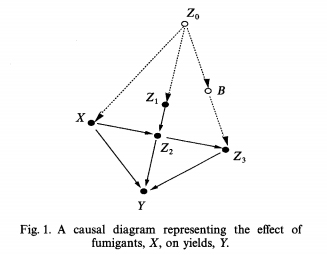
This supplements Noah Stein's answer. Judea Pearl has written extensively on causal models, both in his book Causality, and in individual papers, such as "Causal Diagrams for Empirical Research," Biometrika, 82(4), 669-710, 1995, from which this figure is taken:
          Fig1

$\endgroup$
2
  • 1
    $\begingroup$ It is worth mentioning that in this context a "causal diagram" and a "graphical model", while both represented by directed graphs, are different things in terms of their interpretation. In particular, graphical models encode conditional independence relationship among random variables and a big part of Pearl's work is devoted to driving home the point that these relationships are not in themselves sufficient to tell causal stories. $\endgroup$
    – R Hahn
    Commented Apr 23, 2012 at 15:23
  • $\begingroup$ @RHahn: Thanks for the clarification. $\endgroup$ Commented Apr 23, 2012 at 15:32
1
$\begingroup$

Do you mean something like this?

http://www-devel.cs.ubc.ca/~murphyk/Papers/ismb99.pdf

$\endgroup$
1
  • $\begingroup$ Thank you for the answer, this is surely something close, but it seems it does not touch the "diagnosis of diseases" part (which is most interesting for me :( $\endgroup$ Commented Apr 23, 2012 at 13:05

You must log in to answer this question.

Not the answer you're looking for? Browse other questions tagged .