small clarifications
Source Link
Jukka Kohonen
  • 4.2k
  • 2
  • 21
  • 49

Comparing orthants 4 and 7, we observe the latter has greater $\lVert v_1 \rVert$, but clearly smaller probability. I calculated the probabilities with two methods: p is from MATLAB mvncdf which claims absolute error tolerance $10^{-4}$, and p_MC is from Monte-Carlo integration with $10^7$ points. The probabilities differ already in the second decimal, so I'm pretty confident that it is not just a numerical roundoffan artefact of numerical calculation.

More counterexamples can be generated by making random instances and checking the orthant probabilities: the conjecture fails every now and then, although it holds in most of the cases. Interestingly, in 3 dimensions I have not found any counterexample in thousands of random instances (either in the prolate case = large eigenvalue is single and small eigenvalue is double, or in the oblate case = large is double and small is single).

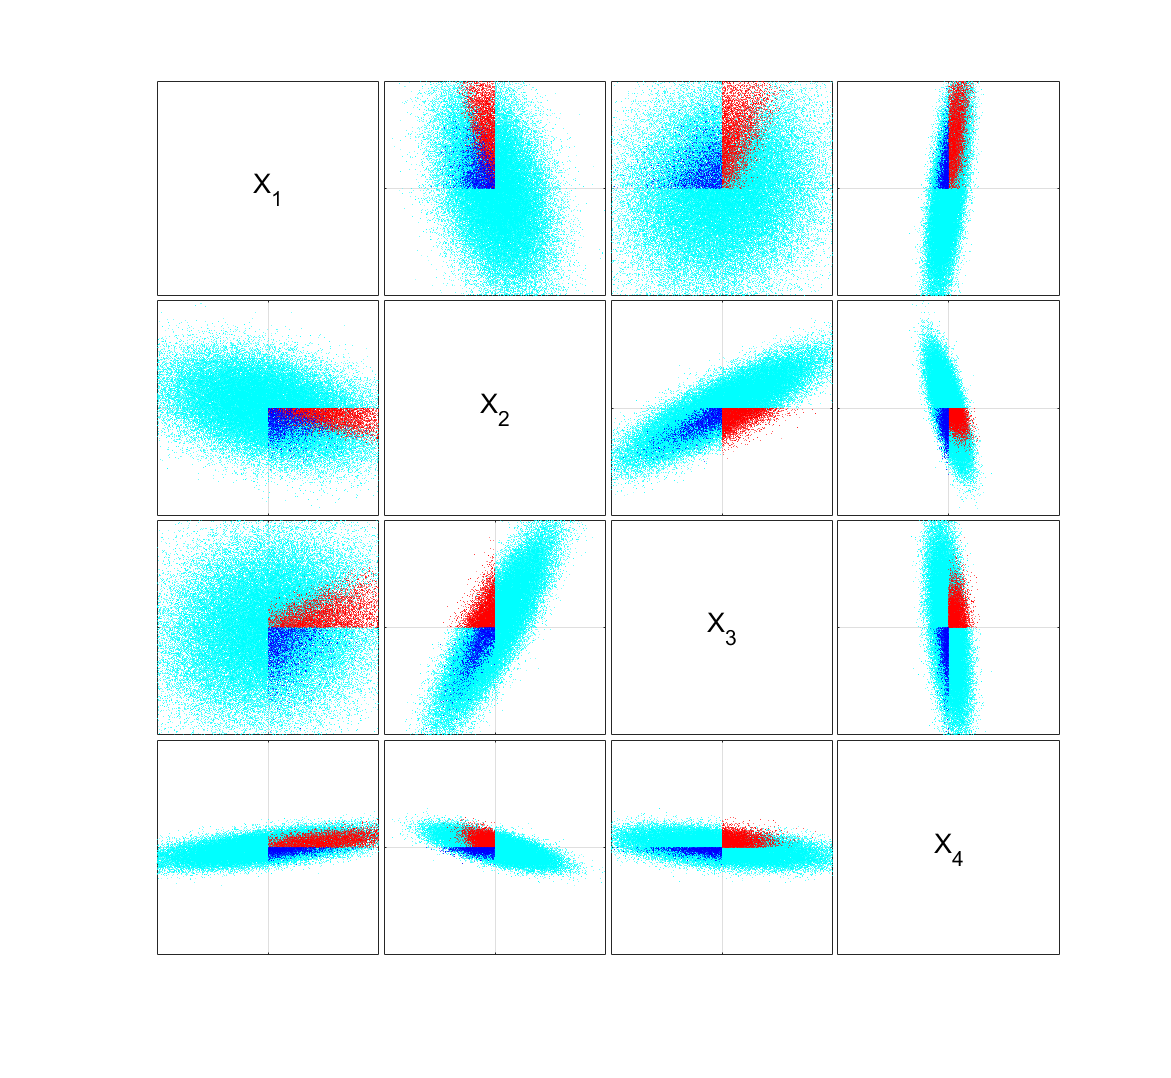
Each subplot shows a 2D projection to two coordinate axes, in the same scale (each: each box ranges from $-20$ to $+20$ in both directions). Note that the two contending orthants are in the same quadrant of $X_1,X_2$, and in opposite quadrants of $X_3,X_4$.

Comparing orthants 4 and 7, we observe the latter has greater $\lVert v_1 \rVert$, but clearly smaller probability. I calculated the probabilities with two methods: p is from MATLAB mvncdf which claims absolute error tolerance $10^{-4}$, and p_MC is from Monte-Carlo integration with $10^7$ points. The probabilities differ already in the second decimal, so I'm pretty confident that it is not just a numerical roundoff artefact.

More counterexamples can be generated by making random instances and checking the orthant probabilities: the conjecture fails every now and then, although it holds in most of the cases. Interestingly, in 3 dimensions I have not found any counterexample in thousands of random instances.

Each subplot shows a 2D projection to two coordinate axes, in the same scale (each box ranges from $-20$ to $+20$ in both directions).

Comparing orthants 4 and 7, we observe the latter has greater $\lVert v_1 \rVert$, but clearly smaller probability. I calculated the probabilities with two methods: p is from MATLAB mvncdf which claims absolute error tolerance $10^{-4}$, and p_MC is from Monte-Carlo integration with $10^7$ points. The probabilities differ already in the second decimal, so I'm pretty confident that it is not just an artefact of numerical calculation.

More counterexamples can be generated by making random instances and checking the orthant probabilities: the conjecture fails every now and then, although it holds in most of the cases. Interestingly, in 3 dimensions I have not found any counterexample in thousands of random instances (either in the prolate case = large eigenvalue is single and small eigenvalue is double, or in the oblate case = large is double and small is single).

Each subplot shows a 2D projection to two coordinate axes, in the same scale: each box ranges from $-20$ to $+20$ in both directions. Note that the two contending orthants are in the same quadrant of $X_1,X_2$, and in opposite quadrants of $X_3,X_4$.

visualization as plotmatrix
Source Link
Jukka Kohonen
  • 4.2k
  • 2
  • 21
  • 49

Figure

Here is an attempt to visualize the 4-dimensional distribution (if anyone has better suggestions, I'd like to hear). We are showing $100\,000$ random points from the distribution; points in the 4th orthant +-++ are shown red, points in the 7th orthant +--- are shown blue, and all other points cyan. Perhaps one can see that the red points are more than twice as many as the blue points.

Each subplot shows a 2D projection to two coordinate axes, in the same scale (each box ranges from $-20$ to $+20$ in both directions).

Plotmatrix of the 4D counterexample

Code

clarify what is false
Source Link
Jukka Kohonen
  • 4.2k
  • 2
  • 21
  • 49

Surprisingly, it seemsthe conjecture is false. Orthant probabilities are not always ordered by the vector norm $\lVert v_1 \rVert$. 

For a counterexample, take the 4-dimensional normal distribution with the following covariance matrix:

Surprisingly, it seems false. For a counterexample, take the 4-dimensional normal distribution with the following covariance matrix:

Surprisingly, the conjecture is false. Orthant probabilities are not always ordered by the vector norm $\lVert v_1 \rVert$. 

For a counterexample, take the 4-dimensional normal distribution with the following covariance matrix:

Source Link
Jukka Kohonen
  • 4.2k
  • 2
  • 21
  • 49
Loading