replace broken link to mathematica notebook with internet archive link, replace images (not archived) with figures from the notebook, fix a few typos
Source Link
j.c.
  • 13.6k
  • 3
  • 52
  • 90

Let's first interpret the theorem mentioned in the question: that the diameter of the Delaunay triangulation for $P$ has expected diameter $\Theta(\sqrt n)$. For each $n$, the Delaunay triangualationstriangulations for $P$ define a probability measure on the space of metrics on $n$-element subsets of the unit square. We can interpolate this metric to a metric on the unit square by making each triangle of the Delaunay triangulation an equilateral triangle, and rescale it by $1/\sqrt n$ to get a measure on the space of metrics on the square. As $n$ goes to infinity, these metrics have uniformly bounded $\epsilon$ complexity (=minimum number of balls of size $\epsilon$ needed to cover). The set of metrics of $\epsilon$-complexity bounded by some fixed function of $\epsilon$ is compact in the Gromov-Hausdorff topology, so the space of probability measures on these metric spaces is compact in the weak topology, so therethere exists at least a subseqeuncesubsequence of $n$ such that the scaled Delaunay metrics converge to a measure on metric spaces.

That the metric of the plane is the actual limit, not just a limit point, follows from considerations parallel to the fact that a rescaled limit of a Lipschitz function is a.s. linear. If there were any signficantsignificant probability of signficantsignificant deviation at any stage, these would accumulate and prevent the large-scale map from being LipshcitzLipschitz.

alt text http://dl.dropbox.com/u/5390048/MinimalSpanningTree1500.jpgalt text
alt text http://dl.dropbox.com/u/5390048/MinimalSpanningTree10000.jpgalt text

alt text http://dl.dropbox.com/u/5390048/MinimalSpanningTreesDiameter.jpgalt text

The Mathematica notebook containing these computations is herehere. The code in the notebook itself is brief, since algorithms for Delaunay triangulations and minimum spanning trees and graph diameter are provided in packages in the Mathematica distribution. It took me more effort to make it work thanthan it should have, because functions in these auxiliary packages are poorly documented. Here are some simple ideas for better showing what's happening, and analyzing further:

  1. Draw the Delaunay triangulation in a different color, along with the tree
  2. Indicate the increasing clumps accessible with changing step size by edge thickness and/or color coding edges of the spanning tree. One idea is to use random colors for short edges within clumps, then use a saturated average color (with average weighted by clump size) when new edges make clumps collide and merge. Delaunay triangles could also be color coded to indicate clumping.
  3. Make a 3-dimensional plot of graph distance from a randomly selected member of $P$ to other elements of the tree, using the TriangularSurfacePlotTriangularSurfacePlot function from the ComputationalGeometryComputationalGeometry package. Also: try showing distance from basepoint by color coding, perhaperhaps
  4. Do bigger experiments, and make plots showing the actual data: e.g. make a ListPlot[]ListPlot[] of the log of the actual diameter for trees of sizes something like `Floor[Exp[ Range[2,6,.01]]]'Floor[Exp[ Range[2,6,.01]]], but start with a much more modest range and aim for a more ambitious range.
  5. Draw contour plots or 3-D plots of Delaunay graph distance from a randomly selected vertex. How quickly do the contour lines begin to look like circles as the size of $P$ increases?

Let's look at this problem on the surface of a sphere, instead of the unit square. The Delaunay triangulation of a set $P$ on the sphere is invariant under Moebius transformations (easy to verify by the definition in terms of circles), and it is equivalent to the triangulation of the convex hull of $P$. A set in the plane can be transformed to the sphere by stereographic projection. It's Its Dealaunay triangulation is equivalent to a subset of the polyhedron, namely the part on the far side from the center of projection. The problems, for the uniform distribution on the square and the uniform distribution on $S^2$, are equivalent, but the spherical setting has more symmetry.

Let's first interpret the theorem mentioned in the question: that the diameter of the Delaunay triangulation for $P$ has expected diameter $\Theta(\sqrt n)$. For each $n$, the Delaunay triangualations for $P$ define a probability measure on the space of metrics on $n$-element subsets of the unit square. We can interpolate this metric to a metric on the unit square by making each triangle of the Delaunay triangulation an equilateral triangle, and rescale it by $1/\sqrt n$ to get a measure on the space of metrics on the square. As $n$ goes to infinity, these metrics have uniformly bounded $\epsilon$ complexity (=minimum number of balls of size $\epsilon$ needed to cover). The set of metrics of $\epsilon$-complexity bounded by some fixed function of $\epsilon$ is compact in the Gromov-Hausdorff topology, so the space of probability measures on these metric spaces is compact in the weak topology, so there exists at least a subseqeunce of $n$ such that the scaled Delaunay metrics converge to a measure on metric spaces.

That the metric of the plane is the actual limit, not just a limit point, follows from considerations parallel to the fact that a rescaled limit of a Lipschitz function is a.s. linear. If there were any signficant probability of signficant deviation at any stage, these would accumulate and prevent the large-scale map from being Lipshcitz.

alt text http://dl.dropbox.com/u/5390048/MinimalSpanningTree1500.jpg

alt text http://dl.dropbox.com/u/5390048/MinimalSpanningTree10000.jpg
alt text http://dl.dropbox.com/u/5390048/MinimalSpanningTreesDiameter.jpg
The Mathematica notebook containing these computations is here. The code in the notebook itself is brief, since algorithms for Delaunay triangulations and minimum spanning trees and graph diameter are provided in packages in the Mathematica distribution. It took me more effort to make it work than it should have, because functions in these auxiliary packages are poorly documented. Here are some simple ideas for better showing what's happening, and analyzing further:

  1. Draw the Delaunay triangulation in a different color, along with the tree
  2. Indicate the increasing clumps accessible with changing step size by edge thickness and/or color coding edges of the spanning tree. One idea is to use random colors for short edges within clumps, then use a saturated average color (with average weighted by clump size) when new edges make clumps collide and merge. Delaunay triangles could also be color coded to indicate clumping.
  3. Make a 3-dimensional plot of graph distance from a randomly selected member of $P$ to other elements of the tree, using the TriangularSurfacePlot function from the ComputationalGeometry package. Also: try showing distance from basepoint by color coding, perha
  4. Do bigger experiments, and make plots showing the actual data: e.g. make a ListPlot[] of the log of the actual diameter for trees of sizes something like `Floor[Exp[ Range[2,6,.01]]]', but start with a much more modest range and aim for a more ambitious range.
  5. Draw contour plots or 3-D plots of Delaunay graph distance from a randomly selected vertex. How quickly do the contour lines begin to look like circles as the size of $P$ increases?

Let's look at this problem on the surface of a sphere, instead of the unit square. The Delaunay triangulation of a set $P$ on the sphere is invariant under Moebius transformations (easy to verify by the definition in terms of circles), and it is equivalent to the triangulation of the convex hull of $P$. A set in the plane can be transformed to the sphere by stereographic projection. It's Dealaunay triangulation is equivalent to a subset of the polyhedron, namely the part on the far side from the center of projection. The problems, for the uniform distribution on the square and the uniform distribution on $S^2$, are equivalent, but the spherical setting has more symmetry.

Let's first interpret the theorem mentioned in the question: that the diameter of the Delaunay triangulation for $P$ has expected diameter $\Theta(\sqrt n)$. For each $n$, the Delaunay triangulations for $P$ define a probability measure on the space of metrics on $n$-element subsets of the unit square. We can interpolate this metric to a metric on the unit square by making each triangle of the Delaunay triangulation an equilateral triangle, and rescale it by $1/\sqrt n$ to get a measure on the space of metrics on the square. As $n$ goes to infinity, these metrics have uniformly bounded $\epsilon$ complexity (=minimum number of balls of size $\epsilon$ needed to cover). The set of metrics of $\epsilon$-complexity bounded by some fixed function of $\epsilon$ is compact in the Gromov-Hausdorff topology, so the space of probability measures on these metric spaces is compact in the weak topology, so there exists at least a subsequence of $n$ such that the scaled Delaunay metrics converge to a measure on metric spaces.

That the metric of the plane is the actual limit, not just a limit point, follows from considerations parallel to the fact that a rescaled limit of a Lipschitz function is a.s. linear. If there were any significant probability of significant deviation at any stage, these would accumulate and prevent the large-scale map from being Lipschitz.

alt text

alt text

alt text

The Mathematica notebook containing these computations is here. The code in the notebook itself is brief, since algorithms for Delaunay triangulations and minimum spanning trees and graph diameter are provided in packages in the Mathematica distribution. It took me more effort to make it work than it should have, because functions in these auxiliary packages are poorly documented. Here are some simple ideas for better showing what's happening, and analyzing further:

  1. Draw the Delaunay triangulation in a different color, along with the tree
  2. Indicate the increasing clumps accessible with changing step size by edge thickness and/or color coding edges of the spanning tree. One idea is to use random colors for short edges within clumps, then use a saturated average color (with average weighted by clump size) when new edges make clumps collide and merge. Delaunay triangles could also be color coded to indicate clumping.
  3. Make a 3-dimensional plot of graph distance from a randomly selected member of $P$ to other elements of the tree, using the TriangularSurfacePlot function from the ComputationalGeometry package. Also: try showing distance from basepoint by color coding, perhaps
  4. Do bigger experiments, and make plots showing the actual data: e.g. make a ListPlot[] of the log of the actual diameter for trees of sizes something like Floor[Exp[ Range[2,6,.01]]], but start with a much more modest range and aim for a more ambitious range.
  5. Draw contour plots or 3-D plots of Delaunay graph distance from a randomly selected vertex. How quickly do the contour lines begin to look like circles as the size of $P$ increases?

Let's look at this problem on the surface of a sphere, instead of the unit square. The Delaunay triangulation of a set $P$ on the sphere is invariant under Moebius transformations (easy to verify by the definition in terms of circles), and it is equivalent to the triangulation of the convex hull of $P$. A set in the plane can be transformed to the sphere by stereographic projection. Its Dealaunay triangulation is equivalent to a subset of the polyhedron, namely the part on the far side from the center of projection. The problems, for the uniform distribution on the square and the uniform distribution on $S^2$, are equivalent, but the spherical setting has more symmetry.

Added link to code, and description of further ideas for illustrating and analyzing
Source Link
Bill Thurston
  • 25.1k
  • 12
  • 99
  • 117

The Mathematica notebook containing these computations is here. The code in the notebook itself is brief, since algorithms for Delaunay triangulations and minimum spanning trees and graph diameter are provided in packages in the Mathematica distribution. It took me more effort to make it work than it should have, because functions in these auxiliary packages are poorly documented. Here are some simple ideas for better showing what's happening, and analyzing further:

  1. Draw the Delaunay triangulation in a different color, along with the tree
  2. Indicate the increasing clumps accessible with changing step size by edge thickness and/or color coding edges of the spanning tree. One idea is to use random colors for short edges within clumps, then use a saturated average color (with average weighted by clump size) when new edges make clumps collide and merge. Delaunay triangles could also be color coded to indicate clumping.
  3. Make a 3-dimensional plot of graph distance from a randomly selected member of $P$ to other elements of the tree, using the TriangularSurfacePlot function from the ComputationalGeometry package. Also: try showing distance from basepoint by color coding, perha
  4. Do bigger experiments, and make plots showing the actual data: e.g. make a ListPlot[] of the log of the actual diameter for trees of sizes something like `Floor[Exp[ Range[2,6,.01]]]', but start with a much more modest range and aim for a more ambitious range.
  5. Draw contour plots or 3-D plots of Delaunay graph distance from a randomly selected vertex. How quickly do the contour lines begin to look like circles as the size of $P$ increases?
added 404 characters in body
Source Link
Bill Thurston
  • 25.1k
  • 12
  • 99
  • 117

After mulling over this question for a few days, I think it's inconsistent with the stated facts stated that the diameter of the Euclidean MST is $\Theta(\sqrt n)$. Here's why.

Let's first interpret the theorem citedmentioned in the question,: that the diameter of the Delaunay triangulation for $P$ has expected diameter $\Theta(\sqrt n)$. For each $n$, the Delaunay triangualations for $P$ define a probability measure on the space of metrics on $n$-element subsets of the unit square. We can interpolate this metric to a metric on the unit square by making each triangle of the Delaunay triangulation an equilateral triangle, and rescale it by $1/\sqrt n$ to get a measure on the space of metrics on the square. As $n$ goes to infinity, these metrics have uniformly bounded $\epsilon$ complexity (=minimum number of balls of size $\epsilon$ needed to cover). The set of metrics of $\epsilon$-complexity bounded by some fixed function of $\epsilon$ is compact, in the Gromov-Hausdorff topology, so the space of probability measures on these metric spaces is compact in the weak topology, so there exists at least a subseqeunce of $n$ such that the scaled Delaunay metrics converge to a measure on metric spaces.

The metric spaces are a.s. Lipschitz equivalent to the standard metric on the unit square, using the theorem about diameter (which can be used to deduce that the Delaunay distance between two random elements $p, q \in P$ is $O(\sqrt n)$). These metrics are path-metric spaces. The shortest paths are rectifiable arcs in the Euclidean sense as well as in the particular metric, since the two metrics are Lipschitz equivalent. A rectifiable arc in the plane has a tangent line almost everywhere, so there are rescaled limits where it looks like aalmost all limiting Delaunay geodesics are straight linelines.

Now consider the MST. The Euclidean MST for a Delaunay triangulation isas a metric tree. Suppose the trees have probable diameter is $\Theta(\sqrt n)$. For each pair of points $x$ and $y$ in the unit square and for each $P$, let $x_P$ be the point of $P$ closest to the $x$, let $y_P$ be closest to $y$, and let $\gamma_P$ be the path in the MST connecting $x_P$ to $y_P$, parametrized by $1/\sqrt(n)$ times the combinatorial Delaunay distance. In the limit, the measure on $P$'s would converge to a probaility measure on rectifiable paths from $x$ to $y$. But more than that, we would get a measurable map from the square cross the square that takes each pair of points to a rectifiable path between them, with arclength less than some constant times their distance.

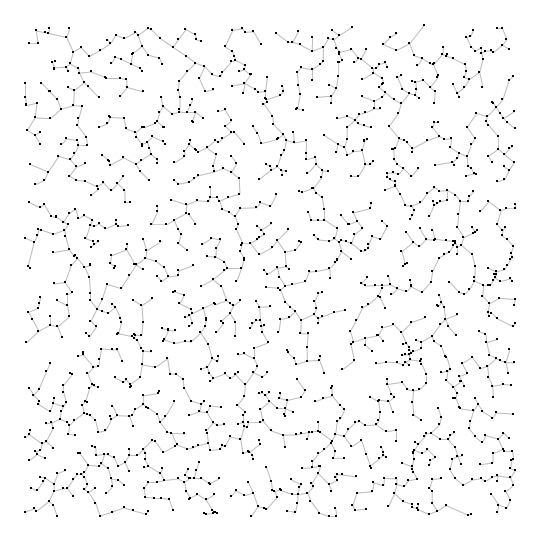
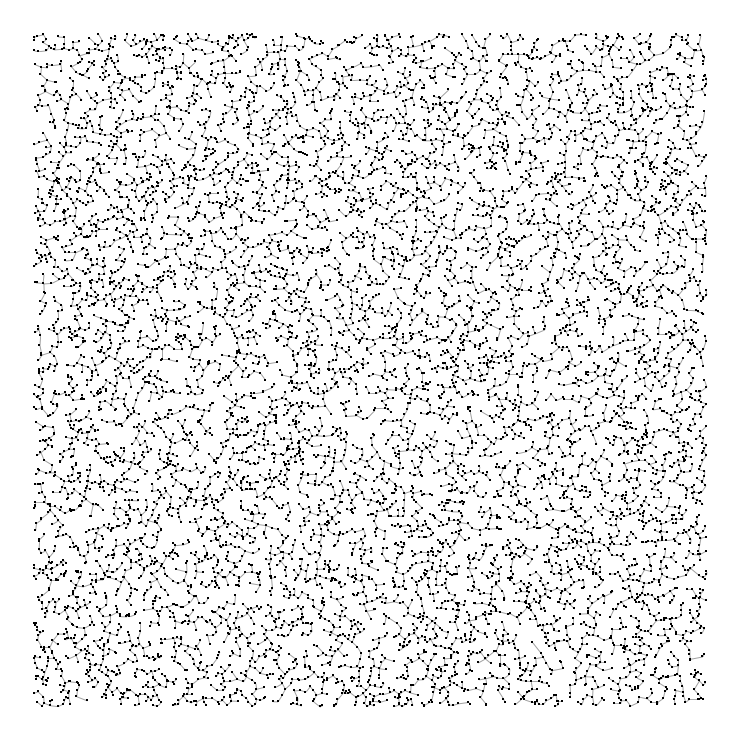
As a further test, I calculated the diameter of the Euclidean MST's for 25 uniform pseudo-ranodmrandom distributions of $2^k$ points, withfor each $k$ ranging from 2 through 8. The sample mean diameters are {2.64, 5.8, 10.32, 18.32, 29.88, 49.12, 78.88}. The best linear fit to to the log of the diameter as a function of $k$ is $.03 + .55 k$. The sample standard deviations for the log of the diameter were nearly constant, all about .15. (that is, the diameters fluctuate on a multiplicative scale, typically about $\pm 16 \%$). It's curious that $Exp[.55] = 1.733$, close to $\sqrt 3 = 1.732$. This suggests a power law that asymptotic diameter $\approx n^{\sqrt 3 / 2}$$\approx n^{]log(\sqrt 3 / 2)}$, but this could be coincidence, since the numerical experiment was modest in size. Here's the plot of log of mean sample diameter vs. $k$:

The actual asymptotic behavior of diameter seems intricately tied with percolation, a subject that I do not understand very well. That is: you can think of building up the MST by successively adding edges of length $t$ if they join points which are not alreadyon different connected components. This gives an increasing union of equivalence relations on elements of $P$, consisting of clumps that can be connected by steps not greater than $t$. One would expect that at for a critical length $t$ greater than some critical distance $t(n)$ that is approximately a constant time $1/\sqrt n$, large-scale clusters are expectedlikely. Paths between points in suchthe a clusterclusters must stay in the cluster. The geometry of the increasing clusters should enable one to estimate the Hausdorff dimension of tree geodesics, which should in turn give thean exponent of growth for the diameter of the Euclidean MST.

After mulling over this question for a few days, I think it's inconsistent with the stated facts stated that the diameter of the Euclidean MST is $\Theta(\sqrt n)$. Here's why.

Let's first interpret the theorem cited in the question, that the diameter of the Delaunay triangulation for $P$ has expected diameter $\Theta(\sqrt n)$. For each $n$, the Delaunay triangualations for $P$ define a probability measure on the space of metrics on $n$-element subsets of the unit square. We can interpolate this metric to a metric on the unit square by making each triangle of the Delaunay triangulation an equilateral triangle, and rescale it by $1/\sqrt n$ to get a measure on the space of metrics on the square. As $n$ goes to infinity, these metrics have uniformly bounded $\epsilon$ complexity (=minimum number of balls of size $\epsilon$ needed to cover). The set of metrics of $\epsilon$-complexity bounded by some fixed function of $\epsilon$ is compact, in the Gromov-Hausdorff topology, so the space of probability measures on these metric spaces is compact in the weak topology, so there exists at least a subseqeunce of $n$ such that the scaled Delaunay metrics converge to a measure on metric spaces.

The metric spaces are a.s. Lipschitz equivalent to the standard metric on the unit square, using the theorem about diameter. These metrics are path-metric spaces. The shortest paths are rectifiable arcs in the Euclidean sense as well as in the particular metric, since the two metrics are Lipschitz equivalent. A rectifiable arc in the plane has a tangent line almost everywhere, so there are rescaled limits where it looks like a straight line.

Now consider the MST. The Euclidean MST for a Delaunay triangulation is a metric tree. Suppose the trees have probable diameter is $\Theta(\sqrt n)$. For each pair of points $x$ and $y$ in the unit square and for each $P$, let $x_P$ be the point of $P$ closest to the $x$, let $y_P$ be closest to $y$, and let $\gamma_P$ be the path in the MST connecting $x_P$ to $y_P$, parametrized by $1/\sqrt(n)$ times the combinatorial Delaunay distance. In the limit, the measure on $P$'s would converge to a probaility measure on rectifiable paths from $x$ to $y$. But more than that, we would get a measurable map from the square cross the square that takes each pair of points to a rectifiable path between them, with arclength less than some constant times their distance.

As a further test, I calculated the diameter of the Euclidean MST's for 25 uniform pseudo-ranodm distributions of $2^k$ points, with $k$ ranging from 2 through 8. The sample mean diameters are {2.64, 5.8, 10.32, 18.32, 29.88, 49.12, 78.88}. The best linear fit to to the log of the diameter as a function of $k$ is $.03 + .55 k$. It's curious that $Exp[.55] = 1.733$, close to $\sqrt 3 = 1.732$. This suggests a power law that asymptotic diameter $\approx n^{\sqrt 3 / 2}$, but this could be coincidence, since the numerical experiment was modest in size. Here's the plot of log of mean sample diameter vs. $k$:

The actual asymptotic behavior of diameter seems intricately tied with percolation, a subject that I do not understand very well. That is: you can think of building up the MST by successively adding edges of length $t$ if they join points which are not already connected. This gives an increasing union of equivalence relations on elements of $P$, consisting of clumps that can be connected by steps not greater than $t$. One would expect that at for a critical length $t$, large-scale clusters are expected. Paths between points in such a cluster must stay in the cluster. The geometry of the increasing clusters should enable one to estimate the Hausdorff dimension of tree geodesics, which should give the exponent of growth for the diameter of the Euclidean MST.

After mulling over this question for a few days, I think it's inconsistent with the stated facts that the diameter of the Euclidean MST is $\Theta(\sqrt n)$. Here's why.

Let's first interpret the theorem mentioned in the question: that the diameter of the Delaunay triangulation for $P$ has expected diameter $\Theta(\sqrt n)$. For each $n$, the Delaunay triangualations for $P$ define a probability measure on the space of metrics on $n$-element subsets of the unit square. We can interpolate this metric to a metric on the unit square by making each triangle of the Delaunay triangulation an equilateral triangle, and rescale it by $1/\sqrt n$ to get a measure on the space of metrics on the square. As $n$ goes to infinity, these metrics have uniformly bounded $\epsilon$ complexity (=minimum number of balls of size $\epsilon$ needed to cover). The set of metrics of $\epsilon$-complexity bounded by some fixed function of $\epsilon$ is compact in the Gromov-Hausdorff topology, so the space of probability measures on these metric spaces is compact in the weak topology, so there exists at least a subseqeunce of $n$ such that the scaled Delaunay metrics converge to a measure on metric spaces.

The metric spaces are a.s. Lipschitz equivalent to the standard metric on the unit square, using the theorem about diameter (which can be used to deduce that the Delaunay distance between two random elements $p, q \in P$ is $O(\sqrt n)$). These metrics are path-metric spaces. The shortest paths are rectifiable arcs in the Euclidean sense as well as in the particular metric, since the two metrics are Lipschitz equivalent. A rectifiable arc in the plane has a tangent line almost everywhere, so there are rescaled limits where almost all limiting Delaunay geodesics are straight lines.

Now consider the Euclidean MST for a Delaunay triangulation as a metric tree. Suppose the trees have probable diameter is $\Theta(\sqrt n)$. For each pair of points $x$ and $y$ in the unit square and for each $P$, let $x_P$ be the point of $P$ closest to the $x$, let $y_P$ be closest to $y$, and let $\gamma_P$ be the path in the MST connecting $x_P$ to $y_P$, parametrized by $1/\sqrt(n)$ times the combinatorial Delaunay distance. In the limit, the measure on $P$'s would converge to a probaility measure on rectifiable paths from $x$ to $y$. But more than that, we would get a measurable map from the square cross the square that takes each pair of points to a rectifiable path between them, with arclength less than some constant times their distance.

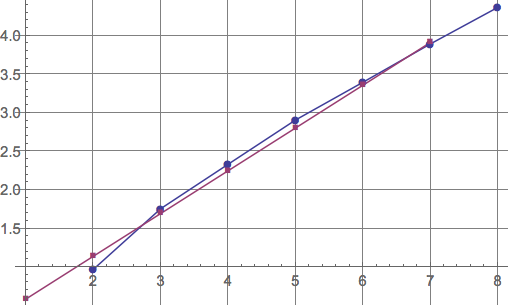
As a further test, I calculated the diameter of the Euclidean MST's for 25 uniform pseudo-random distributions of $2^k$ points, for each $k$ ranging from 2 through 8. The sample mean diameters are {2.64, 5.8, 10.32, 18.32, 29.88, 49.12, 78.88}. The best linear fit to to the log of the diameter as a function of $k$ is $.03 + .55 k$. The sample standard deviations for the log of the diameter were nearly constant, all about .15. (that is, the diameters fluctuate on a multiplicative scale, typically about $\pm 16 \%$). It's curious that $Exp[.55] = 1.733$, close to $\sqrt 3 = 1.732$. This suggests a power law that asymptotic diameter $\approx n^{]log(\sqrt 3 / 2)}$, but this could be coincidence, since the numerical experiment was modest in size. Here's the plot of log of mean sample diameter vs. $k$:

The actual asymptotic behavior of diameter seems intricately tied with percolation, a subject that I do not understand very well. That is: you can think of building up the MST by successively adding edges of length $t$ if they join points on different connected components. This gives an increasing union of equivalence relations on elements of $P$, consisting of clumps that can be connected by steps not greater than $t$. One would expect that for $t$ greater than some critical distance $t(n)$ that is approximately a constant time $1/\sqrt n$, large-scale clusters are likely. Paths between points in the a clusters must stay in the cluster. The geometry of the increasing clusters should enable one to estimate the Hausdorff dimension of tree geodesics, which should in turn give an exponent of growth for the diameter of the Euclidean MST.

Added data about experimental graph diameters
Source Link
Bill Thurston
  • 25.1k
  • 12
  • 99
  • 117
Loading
Added figures of simulations of MST's
Source Link
Bill Thurston
  • 25.1k
  • 12
  • 99
  • 117
Loading
Added discussion of the MST
Source Link
Bill Thurston
  • 25.1k
  • 12
  • 99
  • 117
Loading
added qualifiers about what this addresses
Source Link
Bill Thurston
  • 25.1k
  • 12
  • 99
  • 117
Loading
Source Link
Bill Thurston
  • 25.1k
  • 12
  • 99
  • 117
Loading