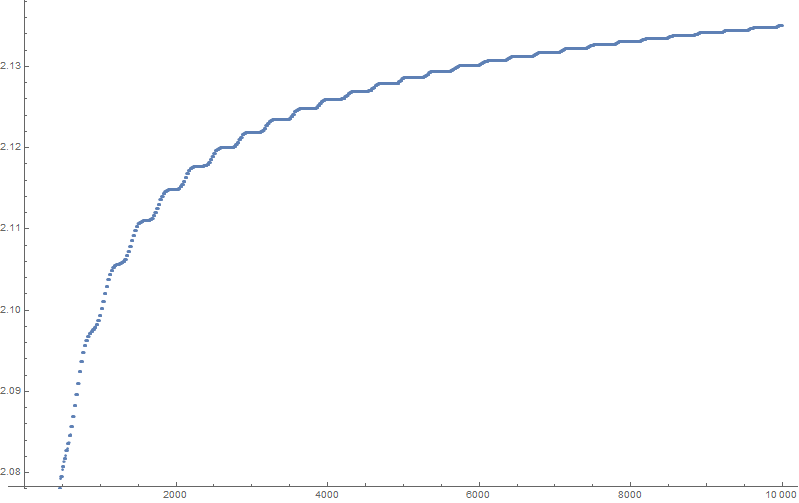
On the OP request, here is the plot of first 10000 partial sums.
Following Terry Tao's suggestion, here is the plot of ($n$th partial sum) $+2^{\frac32}/\sqrt{\pi n}$ for $n$ up to one million:
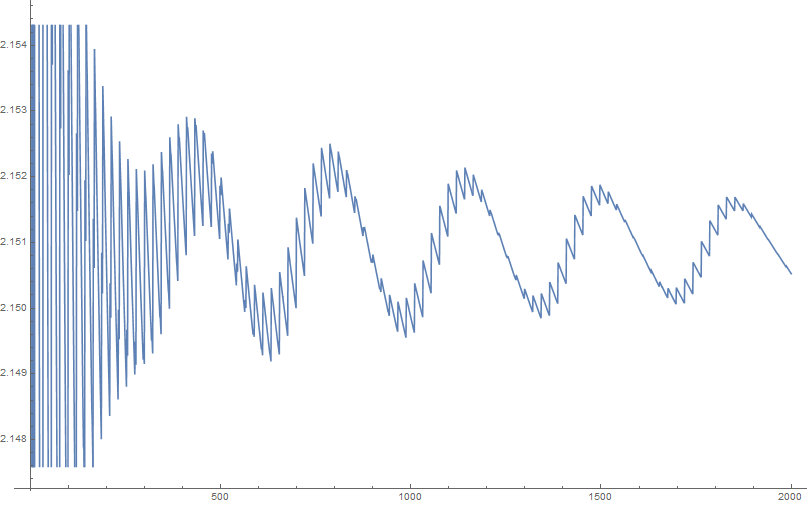
The thick line in the beginning actually consists of high frequency oscillations - in the range up to 2000 it looks like this:
(I hope there are no rounding artifacts, I calculated everything with 100 decimal digits precision)
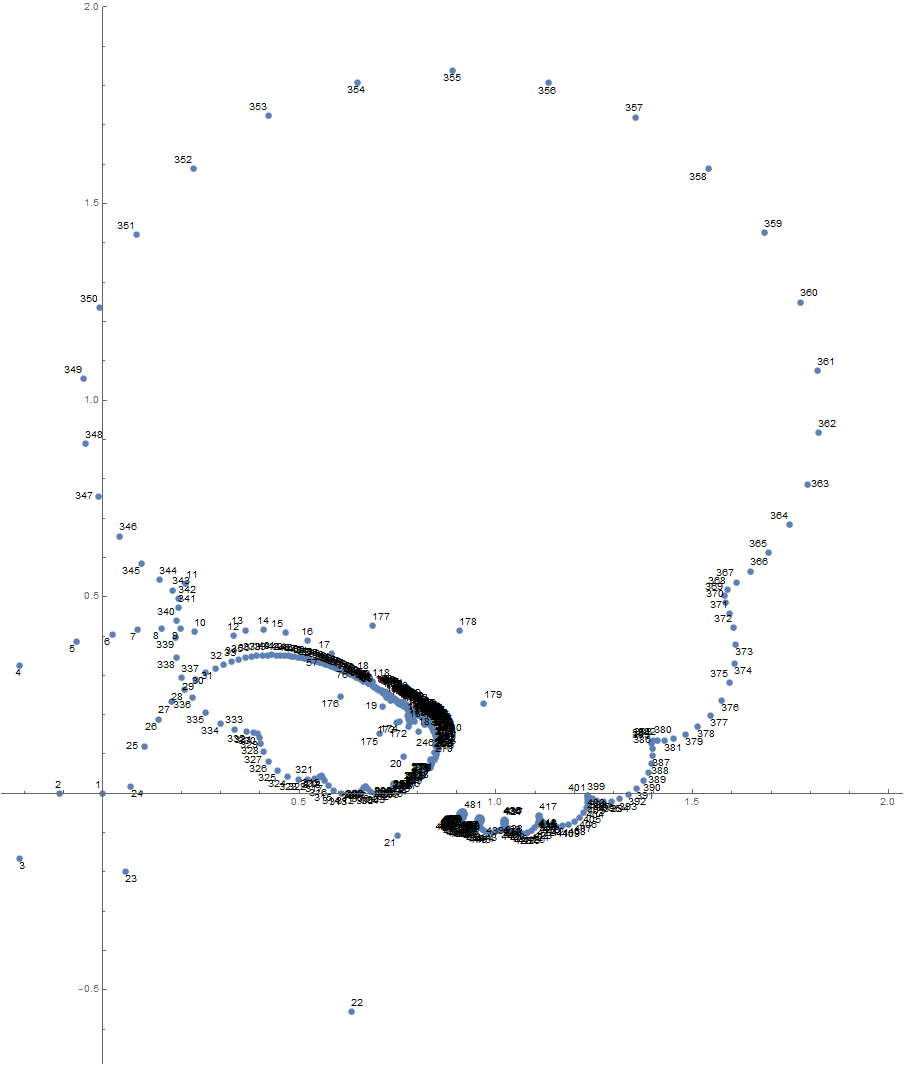
Next, following suggestion by j.c. in a comment below, I tried to plot the (discrete) Fourier transform of the first 10000 points; the result is this:
More precisely, coordinates of the point labeled $n$ are the real and imaginary part of the scalar product of the vector of first 10000 partial sums minus its average with the vector $\left(e^{\frac{2\pi i k}n}\right)_{1\le k\le 10000}$.
You see that $22$ and $355$, as well as $177,178=\frac{355}2\pm\frac12$ are all clearly visible. If I will have more time I will try to do the same with more data, to detect $52163$ mentioned by Terry Tao in a previous comment. I am not sure about the arbitrary phase shift that I introduced, though - I could start with $k=0$ instead of $k=1$, or any other $k$.


