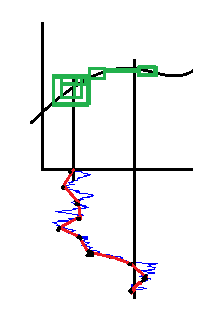
I know this thread is already two years old, but, while preparing for a path integration exam, I arrived at an intuitive picture that sheds some light on the origin of the extra term. The picture represents an integral of a smooth function with respect to a concrete realization of Brownian motion. The sum of the areas of the green rectangles represents the difference between Ito (using the left point of each interval) and "anti-Ito" (using the right point of each interval) for sampling of the Brownian motion represented by the red line. Finer sampling leads to smaller rectangles, but they overlap more and more (because Brownian motion is not monotonic), so even if the area occupied by them tends to zero, the sum of their areas does not. This suggests (only suggests -- it is an upper bound on the difference, not a lower bound) that there is a "room" for Ito and "anti-Ito" to differ in their values. Stratonovich can be expected to lie somewhere in between.
Look at the following image:

