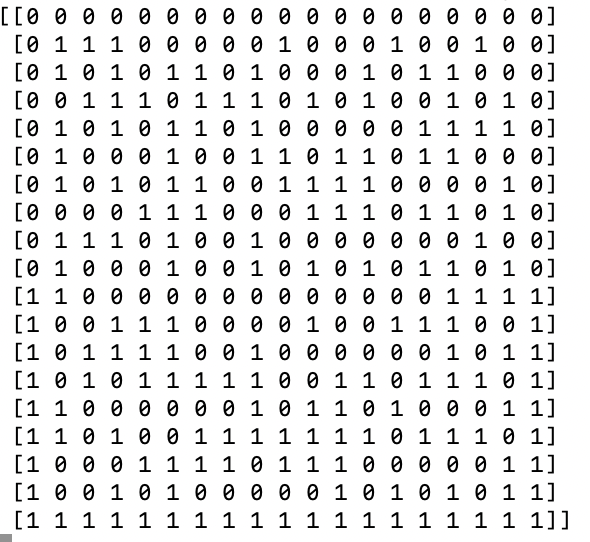
Suppose I have a $n \times n$ square grid and for each square, I assign 1 with probability $\frac{1}{2}$ and 0 with probability $\frac{1}{2}$. On the boundary, I put 1s on the lower half and 0s on the upper half.
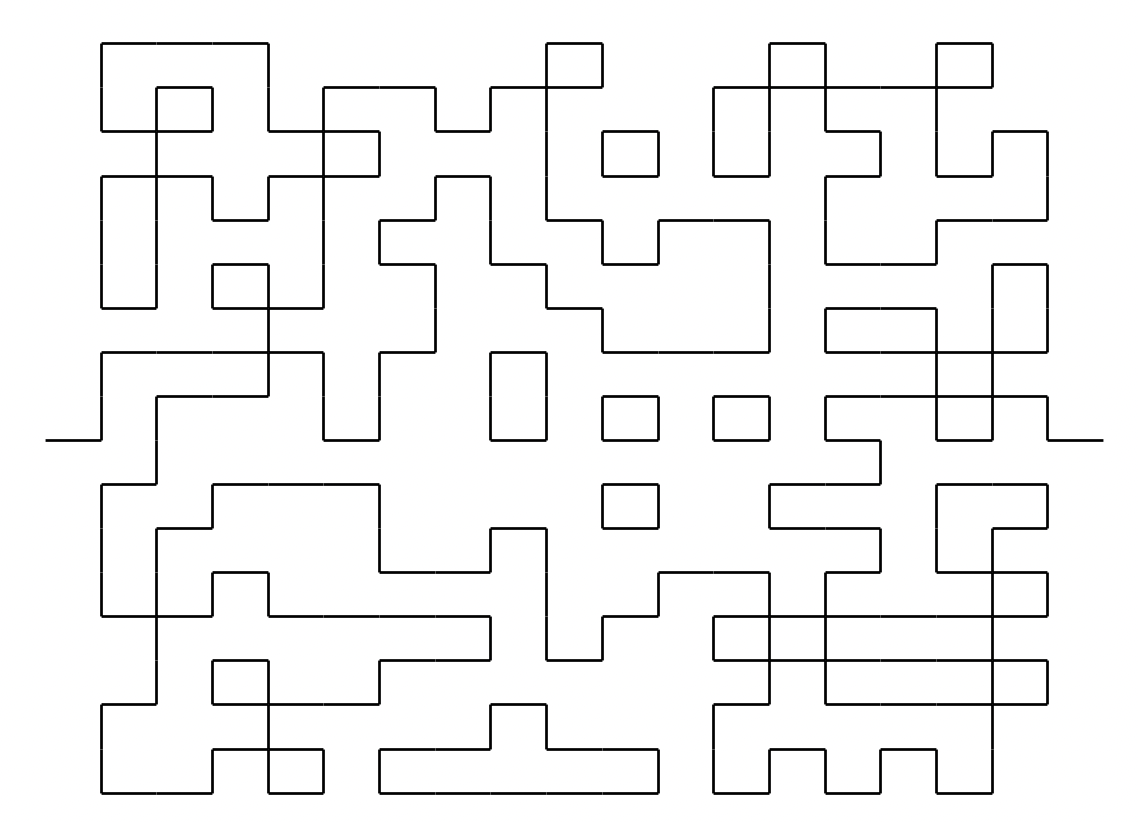
Now, I look at the boundaries between cells with zeros and ones:
Due to the parity constraints there is necessarily a path from the middle left to the middle right (in fact there are many paths).
Now, I am interested in the path from left to right that have the lowest amount of fluctuations as the size of the grid $n$ tends to infinity.
By a huge detour chain of reasoning I can prove that with high probability the path will not fluctuate too much as $n \to \infty$. But how can I see it directly in this picture?


