7
$\begingroup$

Consider a list of $N$ integers $k_1,k_2,\dots k_N$, drawn independently from some distribution $P(k)$ with $k_i \geq 1$. We denote its mean with $\langle k\rangle=\sum_{k=1}kP(k)$. The first two moments of $P(k)$ are finite, and we assume that $N$ is large enough such that the empirical mean approximates 'well enough' the true mean.

I am interested in understanding how the empirical mean evolves as we randomly remove elements from the list, one by one. The probability of removal is proportional to the value of the element. For example, at step 1, element $k_i$ will be removed with probability $\frac{k_i}{\sum_{j=1}^{N}k_j}$. Simply put, elements with high values are more likely to get removed.

In the regime of large $N\gg 1$, is it possible to obtain an (approximative) expression for the empirical mean of the list as a function of the step $n$, with $n\ll N$ ?

I post here, because I suspect precise formulations of this problem exist and have been around for a long time but I lack the specific vocabulary and keywords to find sources. I have seen versions of this problem in random graph theory in the context of vertex removals but I hope to see a more general formulation. (Once equipped with better vocabulary, I can edit the title/question if necessary)

Edit: Consider $P(k)=l(k)k^{-\alpha}$ with $\alpha>3$ where $l(k)$ is a slowly varying function at infinity. Is it possible to describe the empirical mean as a function of $n$ in the regime $1\ll n \ll N$?

$\endgroup$
4
  • $\begingroup$ You can attach independent exponential clocks with parameter $k_i$ to the $i^{th}$ guy and when the clock goes off, you have selected proportional to size. If you were interested in n on the order of N, you can probably approximate the time at which it occurs well enough to approximate the mean of what is left, but for really small n's I think it is just a mess $\endgroup$
    – mike
    Commented Jan 31 at 9:06
  • $\begingroup$ In the regime $N\to\infty$ and $n/N\to0$ that you're asking about, the empirical mean after step $n$ will converge to the true mean. This would be the case even if you simply removed the $n$ largest of the samples. Is that enough for the "(approximative) expression" that you're looking for, or do you need finer asymptotics about the difference between the obtained value and the mean? $\endgroup$ Commented Jan 31 at 11:30
  • 1
    $\begingroup$ P.S. about vocab: a useful term to search with will be "size-biased" $\endgroup$ Commented Jan 31 at 11:32
  • $\begingroup$ @JamesMartin, I would need finer asymptotics. For small $n$ and large $N$ a good approximation of the empirical mean still is $\langle k \rangle$, sure. It becomes non-trivial when we ask what the dependence of $n$ is, especially when $n\gg 1$ while $n\ll N$. Also, just one example coming to my mind: for $P(x) \sim 1/x^4$, even for small $n$ there might be already strong deviation from the true mean. ("size-biased" accurately describes the sampling used in my question, thanks!) $\endgroup$
    – papad
    Commented Feb 5 at 4:50

2 Answers 2

3
+50
$\begingroup$

A simple mean field calculation suggests to look at the solution to $$ \partial_t Q_t(k) = -\frac{k Q_t(k)}{\sum_\ell \ell Q_t(\ell)},\qquad Q_0 = P. $$ For all $n$, one would then expect a good approximation to the empirical distribution after $n$ steps to be $P_{n/N}$ where $P_t = Q_{t}/(1-t)$. The empirical mean you're after would then be approximated by $\sum_k k P_{n/N}(k)$.

In particular, for $n\ll N$, one would get a decent approximation by the first order expansion $$ \frac{\sum_k kP(k)(1-nk/(N\sum_\ell \ell P(\ell)))}{1-nk/N} \approx \mathbb{E} k + \frac{n}{N}\Big(1-\frac{\mathbb{E} k^2}{\mathbb{E} k}\Big),$$ where $\mathbb E$ denotes expectation under $P$.

$\endgroup$
2
  • $\begingroup$ Exactly what I was looking for! Is there anything we can say if $\mathbb{E}k^2$ is not finite? $\endgroup$
    – papad
    Commented Feb 6 at 3:10
  • 1
    $\begingroup$ @Sam When $\alpha \in (2,3)$, I would expect to see a singularity of type $t^{\alpha-2}$ at the origin. When $\alpha \in (1,2)$, I think it should be $t^{(\alpha-2)/(3-\alpha)}$. $\endgroup$ Commented Feb 6 at 8:04
1
$\begingroup$

I doubt this is an easy analysis, as the result is going to be affected by the distribution used for $P(k)$. I doubt there is a general form, but empirically there may be a well-behaved example.

In any case, it seems possible to simulate what happens. There is no need to require the $P(k)$ to be integers so long as there probability $1$ that all the samples are positive.

For example, if $P(k)$ has an exponential distribution with rate $\lambda$ i.e. mean $\frac1\lambda$, it seems from simulation that the expectation of the remaining empirical mean might be $\frac{N-n}{N}\frac1\lambda$ or close to that. As an illustration, here is a simulation using R, with $\lambda=\frac15$ and $N=10^3$ and averaging over $10^4$ cases:

set.seed(2024)
N <- 10^3
numbersims <- 10^4
remainingmean <- function(N){
  X <- rexp(N, 1/5) # distribution must take positive values
  Y <- sample(X, size=N, replace=FALSE, prob=X)
  return((sum(Y) - c(0,cumsum(Y)[-N])) / (N:1))
  }
sims <- replicate(numbersims, remainingmean(N))
plot(0:(N-1), rowMeans(sims), xlab="n removed", ylab="remaining mean") 
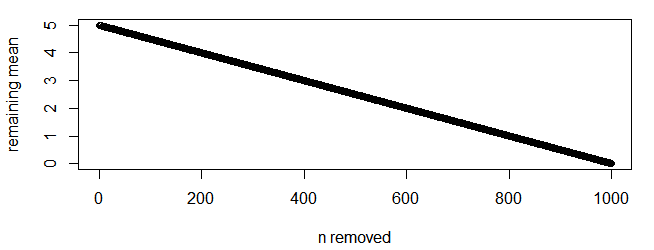
exponential

There is a distribution on the positive integers $\{1,2,3,\ldots\}$ similar to an exponential distribution, namely a suitable geometric distribution, and replacing the appropriate line in the code above with

X <- rgeom(N, 1/5) + 1 # distribution must take positive values

seems to produce a broadly similar chart (though necessarily heading towards $1$ rather than $0$):
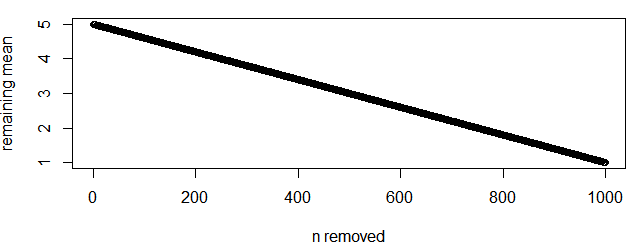
geometric

while a distribution with a lighter tail and a smaller variance, say a Poisson distribution plus $1$, declines more slowly initially

X <- rpois(N, 4) + 1 # distribution must take positive values
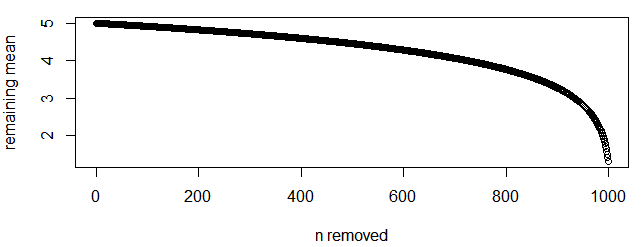
Poisson

while a distribution with a heavier tail and greater variance, say the square of the geometric distribution, declines more quickly initially.

X <- (rgeom(N,1/5) + 1)^2 # distribution must take positive values
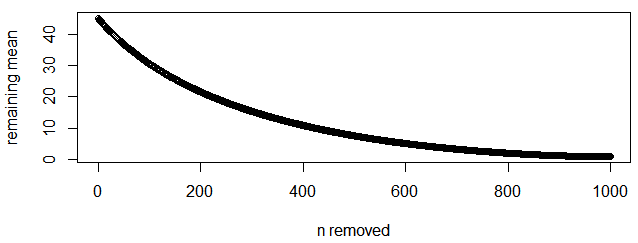
square of geometric

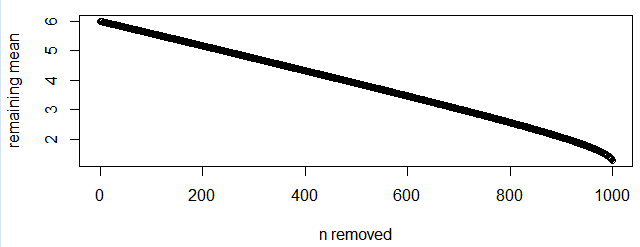
Apart from the unforeseen apparent linearity with an exponential distribution, this all seems intuitively reasonable, at least comparing one distribution with another. But it is not quite as simple as that: adding $1$ to the exponential distribution (so not changing the shape of the tail or the initial variance) keeps the close to linearity effect initially, but visually slightly deviates from it as $n$ reaches $N$ and so presumably deviates initially too but to a lesser effect.

X <- rexp(N, 1/5) + 1 # distribution must take positive values
exponential plus 1

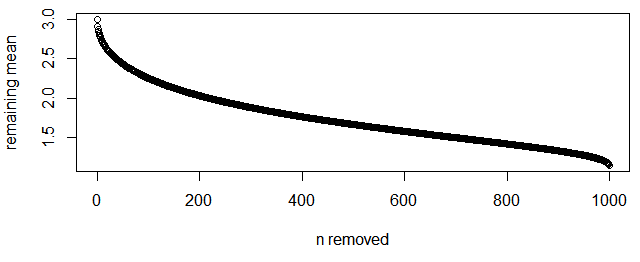
Since it came up in comments, here is an equivalent simulation for a heavy-tailed Pareto distribution with $\alpha = 1.5$ (so initially an expectation of $3$ but infinite variance, so optimistically relying on LLN convergence of the sample mean); the initial drop due to the heavy tail is much faster with a simulated mean of $2.99875$ to start and $2.91492$ after one removal. If a single sampled value is extremely high, then it is very likely to be removed in the first step due to its high weight.

X <- runif(N)^(-1/1.5) # distribution must take positive values
Pareto

$\endgroup$
5
  • $\begingroup$ Nice simulations. The question in the post is specifically: "in the regime of large $N$, is it possible to obtain an (approximative) expression for the empirical mean of the list as a function of the step $n$ with $n\ll N$"? I don't think I'm hallucinating - in this regime the answer (to first order) is simply that the remaining empirical mean converges to the mean of the underlying distribution, right? I asked whether the poster is looking for something more precise than that, but they didn't reply.... $\endgroup$ Commented Feb 3 at 12:52
  • $\begingroup$ @JamesMartin Continuity suggests values of the expected remaining mean on the left after small weighted subsamples are removed will be close to the starting point of the expected sample mean (which I think is your point), but I think the simulations suggest that whether the initial rate of decline towards the finishing point on the right is above or below a linear decline depends on the precise distribution. $\endgroup$
    – Henry
    Commented Feb 3 at 18:03
  • $\begingroup$ My claim specifically: if $Y_{N,n}$ is the (random) empirical mean after removing $n$ of the $N$ values in a size-biased way, then for $N\to\infty$ and $n/N\to0$, $Y_{N,n}$ converges in distribution to the mean of the original distribution. The argument is that even if you took away the $n$ largest values, the change to the empirical mean is $o(1)$ in distribution. The effect of removing in a size-biased way can't be bigger than that. (For general $n$, you can bound the size-biased case between the cases where you remove the largest, or where you remove uniformly at random.) $\endgroup$ Commented Feb 3 at 18:50
  • $\begingroup$ These are nice simulations. They also illustrate that the behaviour will be heavily dependent on the form of $P(k)$. I agree with @JamesMartin, by saying that for distributions like Poisson or even Exponential, approximating the empirical mean as a constant function in terms of the steps $n$ is still a good approximation. However for any distribution $P(x) \sim 1/x^{\alpha}$, with $\alpha>2$, there is a strong decay wrt $n$ and I was hoping to unveil some general description. $\endgroup$
    – papad
    Commented Feb 5 at 4:56
  • $\begingroup$ @Sam That is the advantage of simulation: you can easily have a look at other possibilities. A simulation of a Pareto distribution with $\alpha>2$ does not seem to add much to the others already shown, so instead I have added one with $\alpha = 1.5$. $\endgroup$
    – Henry
    Commented Feb 5 at 9:20

You must log in to answer this question.

Not the answer you're looking for? Browse other questions tagged .