2
$\begingroup$

Let $\zeta^{(k)}(s)$ denote the $k$-the derivative of zeta function.

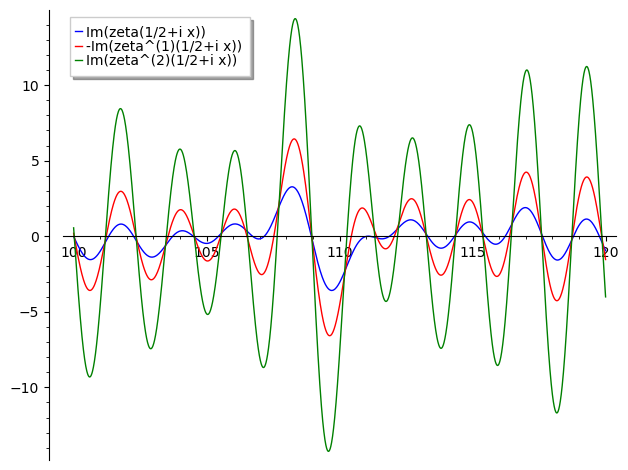
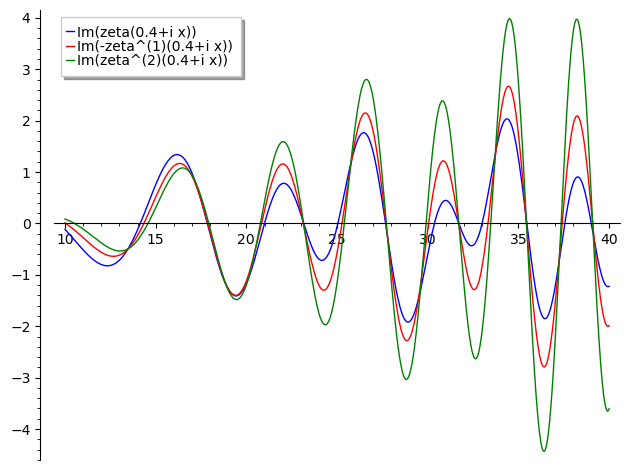
Let $S=\{\Im(\zeta(\sigma +i t)),\Im(-\zeta^{(1)}(\sigma + i t),\Im(\zeta^{(2)}(\sigma + i t))\}$

We are interested in the plots of $S$ on vertical lines.

Here are the plots according to sagemath.

$s=1/2+ i x$

enter image description here

$s=0.4 + i x$

enter image description here

Q1 Why the plots appear similar, but scaled with small additive term, could this be because of functional equation?

Q2 Why the zeros appear grouped?


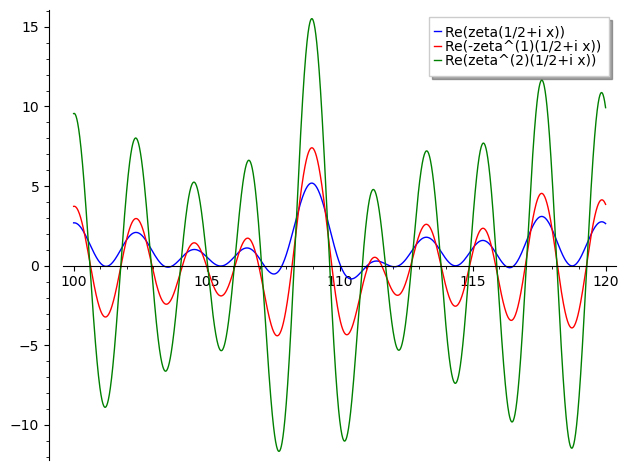
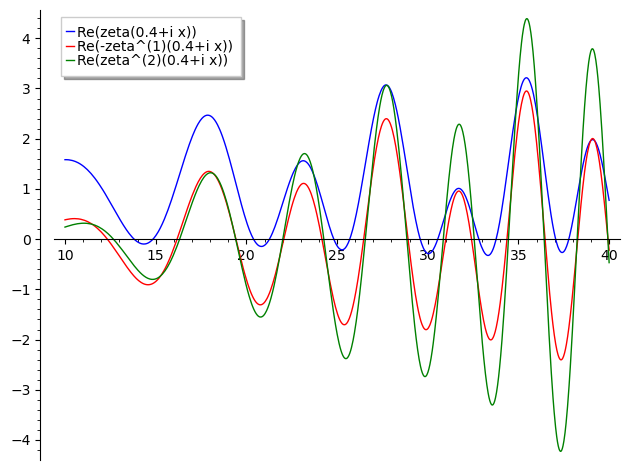
Here are the plots of the real parts

$s=1/2+i x$ enter image description here

$s=0.4+i x$

enter image description here

$\endgroup$
2
  • 1
    $\begingroup$ What do the real parts graphs look like? $\endgroup$
    – Stopple
    Commented Oct 2, 2023 at 15:47
  • $\begingroup$ @Stopple I edited, adding plots of the real part. $\endgroup$
    – joro
    Commented Oct 2, 2023 at 17:33

1 Answer 1

1
$\begingroup$

Because the Dirichlet series for $\zeta(s)$ begins with $1+0i$, the real part of $\zeta(1/2+i t)$ has a bias to be positive. (The Dirichlet series does not converge here, but we have the approximate functional equation.) The imaginary part has no bias; it is positive as often as it is negative. Thus as $t$ increases, $\zeta(1/2+it)$ traces out loops in the plane passing through the origin, which lie mostly (but not entirely) in the right half plane.

Now write $\zeta(1/2+it)$ as $u+iv$, so $\zeta^\prime(1/2+it)=v_t-iu_t$. Then $v=0$ when the loop passes through the origin, and again when it crosses the real axis (typically the positive real axis). There are very near the critical points for the real part - they would be so exactly if the loops were circles centered on the positive real axis passing through the origin.

I think this analysis applies to the inflection points as well.

$\endgroup$

You must log in to answer this question.

Not the answer you're looking for? Browse other questions tagged .