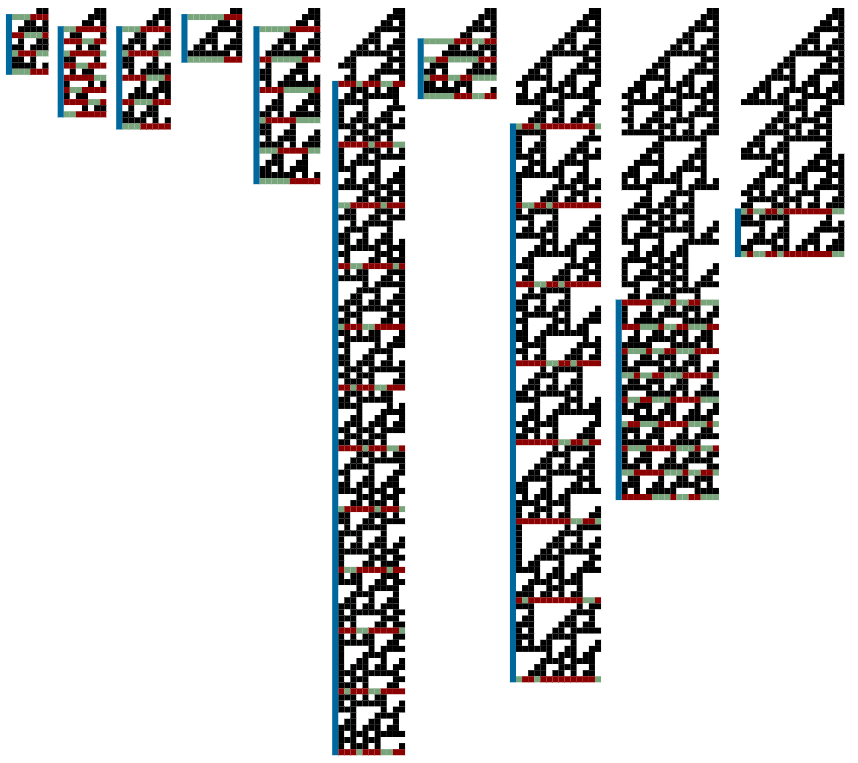
I investigated the long term behaviour of a pair of black cells ■■ on a circle of $N$ cells under the action of each of Wolfram's rules $R$. For each combination $(R,N)$ I determined the first occurrence of a pattern $\pi$ that re-appears $\lambda$ time steps later, shifted by $\sigma$ cells, being the start of a limit cycle. These numbers are enough to tell the length of the limit cycle which is given by
$$L(R,N) = \frac{N}{\text{gcd}(N,\sigma)}\cdot \lambda$$
or equivalently by
$$L(R,N) = \frac{\text{lcm}(N,\sigma)}{v}$$
with $v$ being the "velocity" of the pattern $\pi$, $v = \sigma / \lambda$.
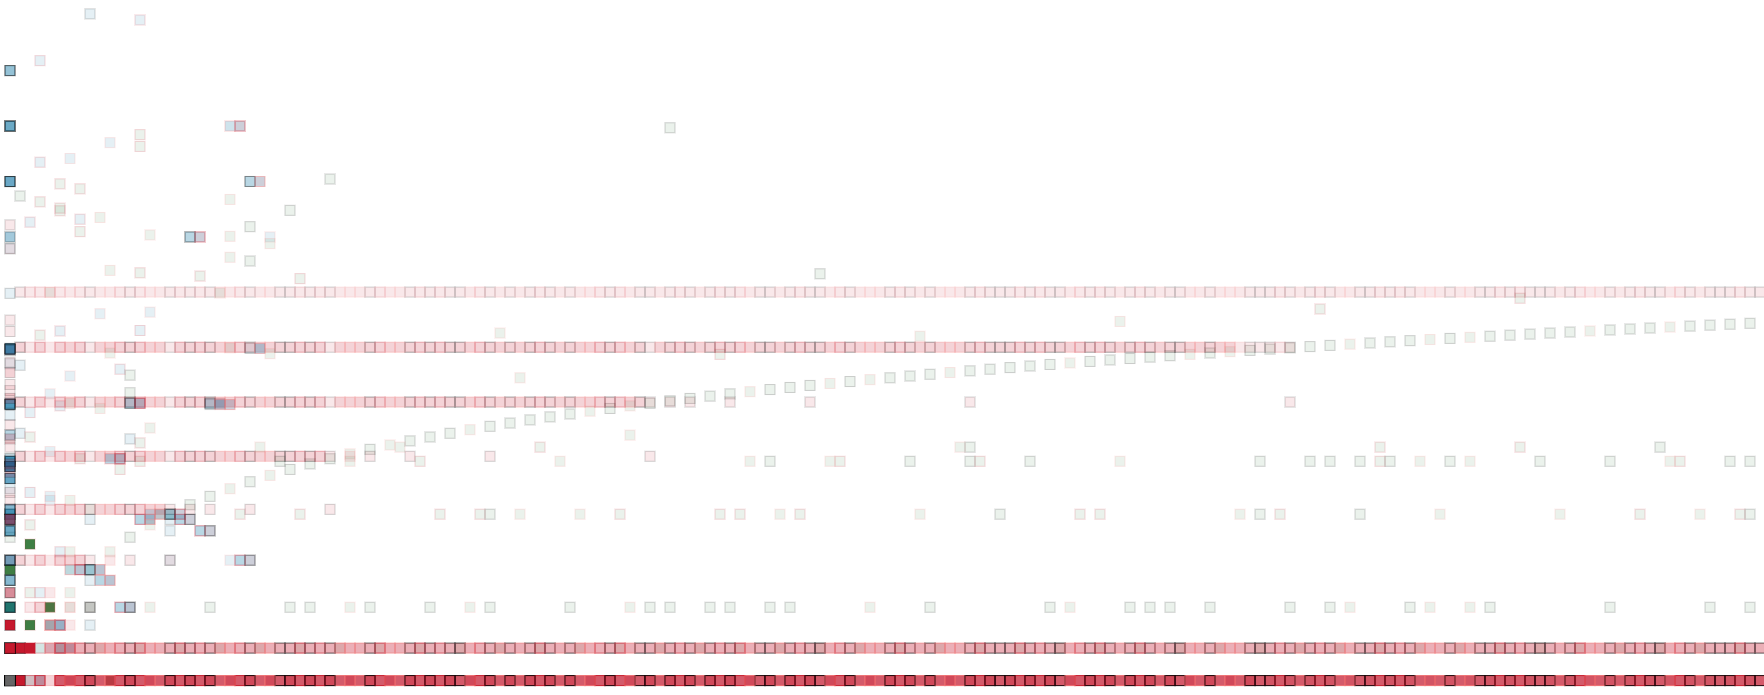
All I did was to plot the velocities for a given rule $R$ in a $\sigma$-$\lambda$ diagram choosing a logarithmic scale for $\lambda$. The shading of the dots indicates multiplicities, i.e. the number of $N$ for which the velocity is achieved. The colors indicate to which of Wolfram's ECA classes the data point belongs, especially green for class IV, blue for class III, red for class II.
All rules
There are proper velocities $v \leq 1$ (above the diagonal, $\lambda \geq \sigma$) and pseudo-velocities $v > 1$ (below the diagonal).
The diagram with class I rules only contains only one dot $(\sigma = 0, \lambda = 1)$.
Class II rules
Class III rules
Class IV rules
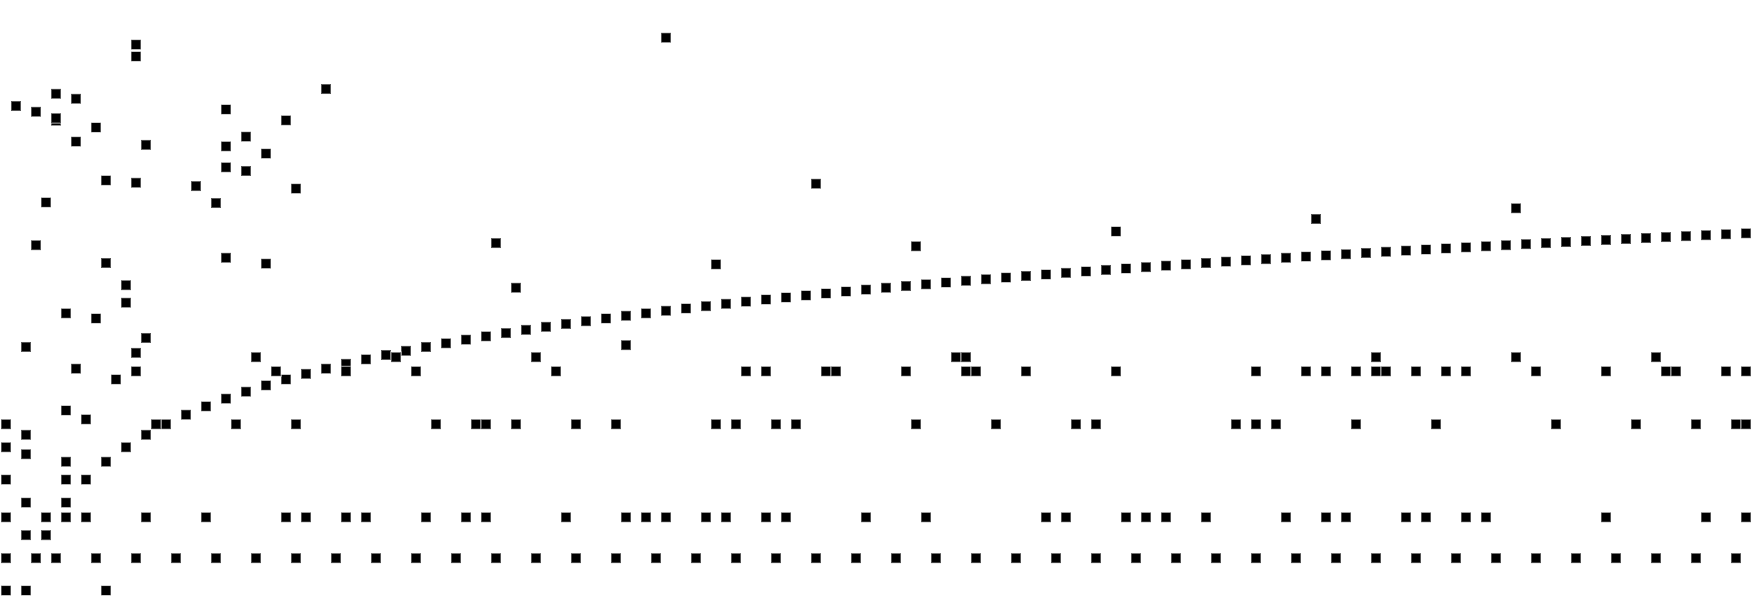
Most of the dots here come from rule 110. Rules 41 and 106 don't contribute too much and behave more like class III rules – for this special start configuration!
Rule 110
Rule 54 gives the (pseudo-)diagonal with $\lambda = \sigma -1$.
Rule 54
Having said and showed this I'd like to ask:
Is there a general procedure to decide if for given $\sigma, \lambda$ there is a rule $R$ and a circle length $N$ giving rise to them? Or – equivalently? – a enumeration of such $\sigma, \lambda$ that is not just brut force calculation?
I think of generating functions as Wolfram uses them in his paper Algebraic Properties of Cellular Automata. But the paper is mostly about rule 90, and I am not able to generalize the approach.
In case the question has to be answered to the negative (as some comments seem to suggest):
Can it be predicted or proved that the $\sigma$-$\lambda$-plot must have the general properties it has (regardless of single rules and exact values):
the existence of a (pseudo-)diagonal?
distinguished gapless horizontal baselines extending to infinity?
distinguished gapless horizontal lines ending at the diagonal?
distinguished horizontal lines starting at the diagonal extending to infinity?
From an answer to this main question, answers to the following sub-questions could be derived:
Why do the horizontal lines that end at the diagonal correspond to $\lambda = 2^k$ for $k \geq 3$.
Why do the (visible) horizontal lines that start at the diagonal correspond to $\lambda = 1, 2, 4, 15, 30, 36, 64$ which is not the beginning of any OEIS sequence?
Why is the diagonal for rule 54 only a pseudo-diagonal, i.e. $\lambda = \sigma - 1$?
Why does rule 110 for $N=1\dots 250$ exhibit multiple velocities only for four velocities:
$(\sigma = 0, \lambda = 7)$ with multiplicity $25/250$
$(\sigma = 2, \lambda = 3)$ with multiplicity $23/250$
$(\sigma = 2, \lambda = 10)$ with multiplicity $13/250$
$(\sigma = 10, \lambda = 1)$ with multiplicity $6/250$
Suppementary material
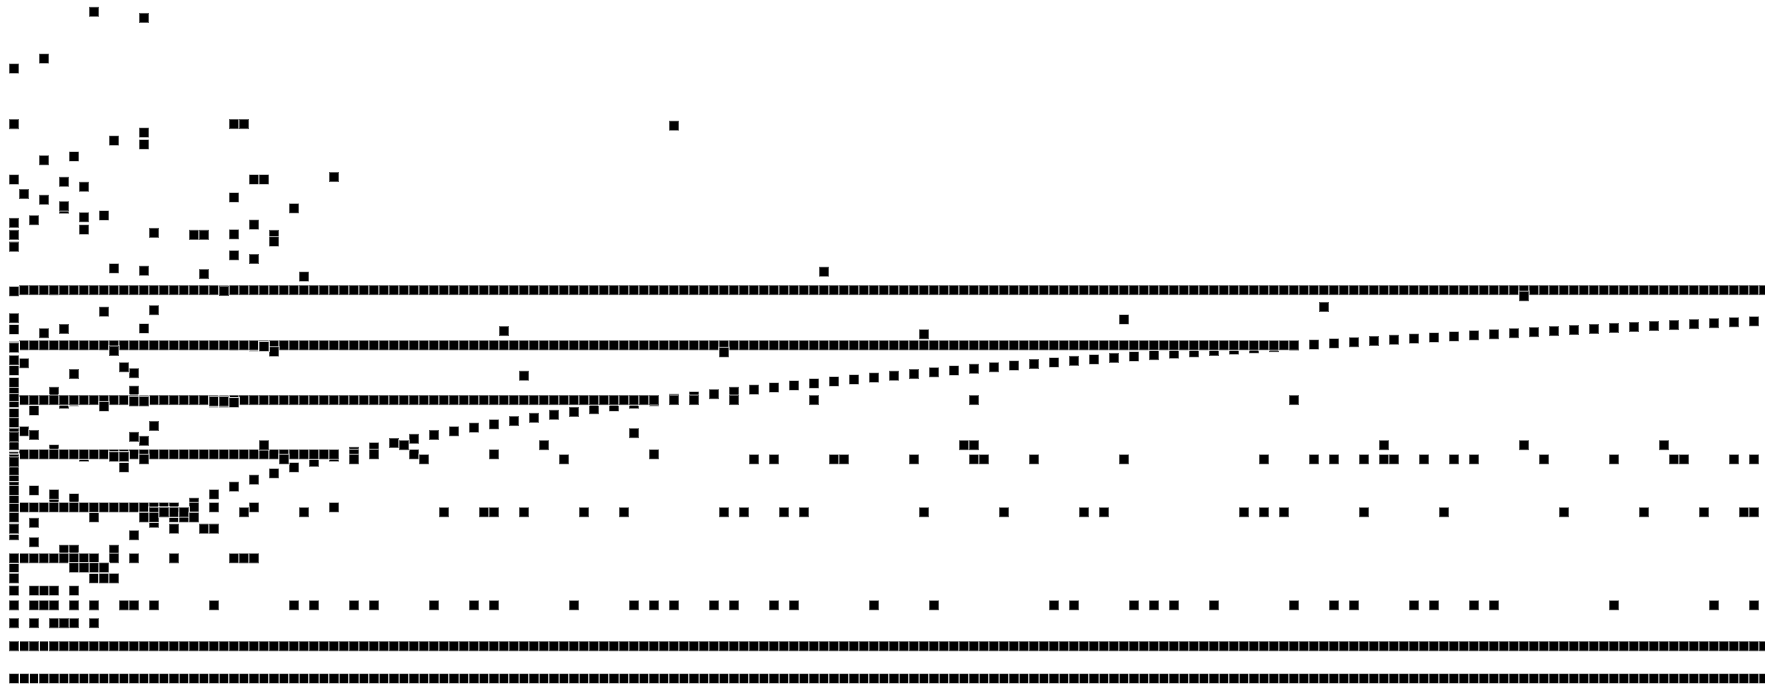
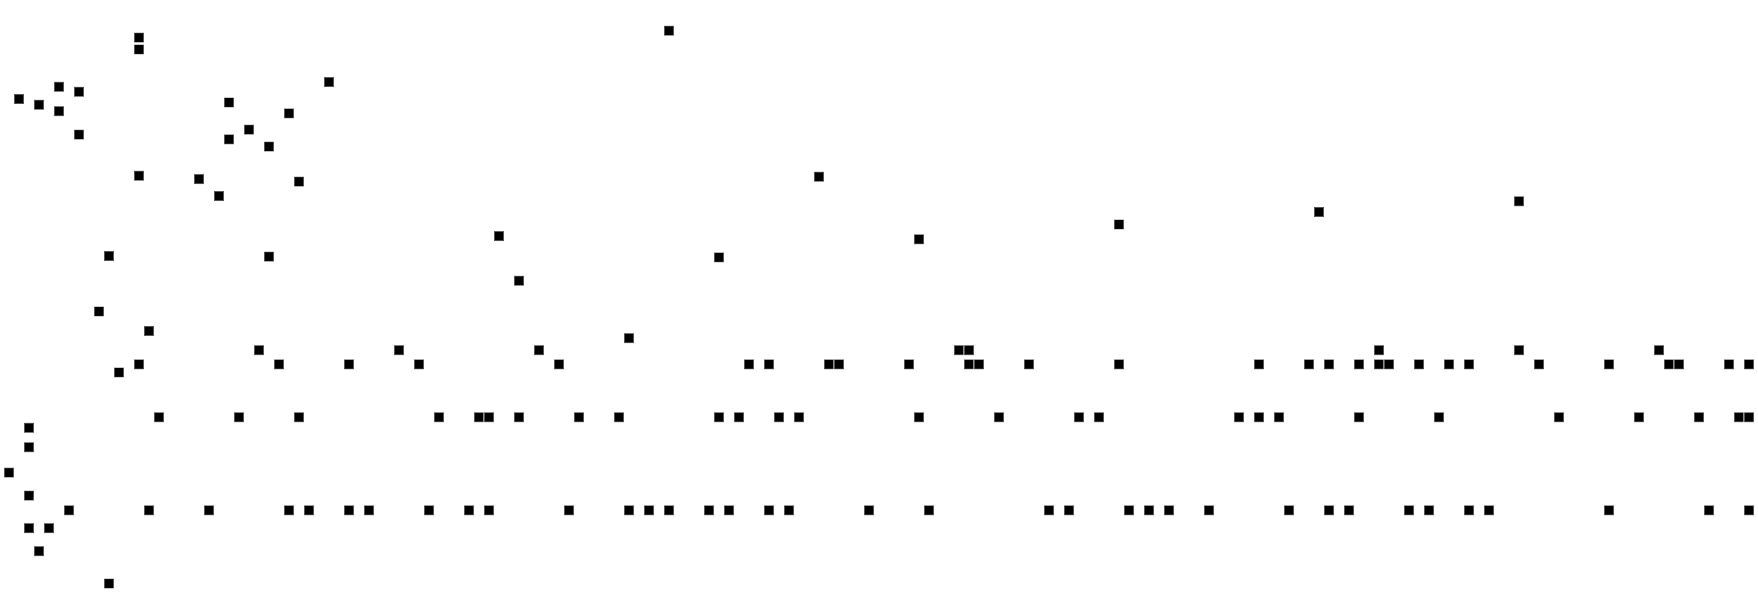
The same diagrams as above but without coloring (for classes) and shading (for multiplicities):
All rules
Class II rules
Class III rules
Class IV rules
Rule 110
Transitions to $\pi$ (the start of the limit cycle, green/red), its shifts, and the limit cycles (blue) for rule 110 and $N=6,7,8,9,10,11,12,14,16,17$:

