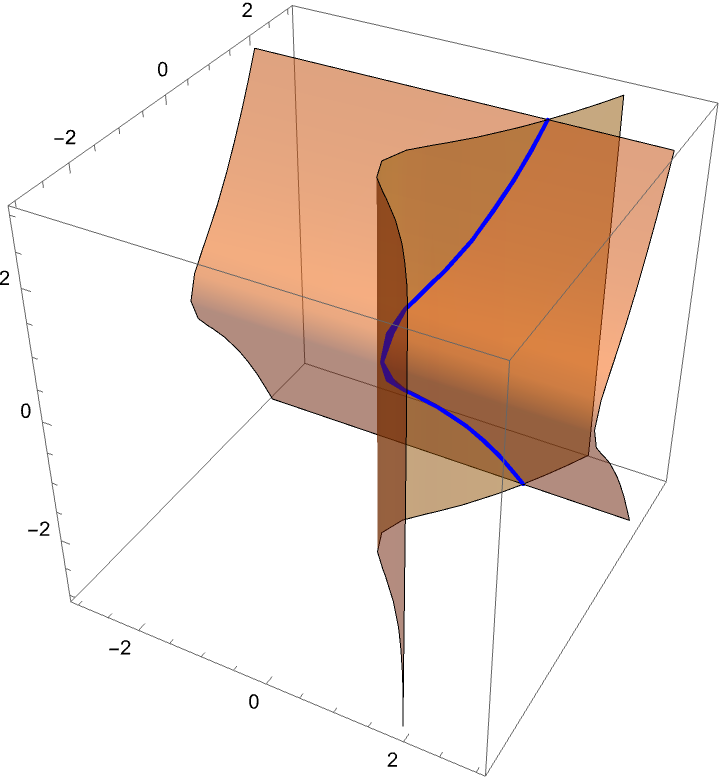
I want to plot the two surfaces which are defined in $ \mathbb{ R }^3 \ni ( x, y, z ) $ via the equations $ 0 = y^2 - x*(x^2 + 1) $ and $ 0 = z^2 - y*(y^2 + 1) $, respectively. Moreover, I want also to highlight the intersection curve of these surfaces.
Any tool is ok for me, but I know that sage has some functions for plotting implicit functions in 3d: The commands
var('x, y, z')
s1 = implicit_plot3d(0 == y^2 - x*(x^2 + 1), (x,-3,3), (y,-3,3), (z,-3,3))
s2 = implicit_plot3d(0 == z^2 - y*(y^2 + 1), (x,-3,3), (y,-3,3), (z,-3,3))
plot(s1 + s2)
plot both surfaces. But I would like to highlight the intersection curve or at least change the transparency-level of the surfaces (changing the alpha-values seems not to do anything)
A bonus would also be if there were a way to directly plot the intersection of these surfaces.
Does anybody know a tool to do this?

 Blue curve is the intersection of the two surfaces