5
$\begingroup$

From Terry Tao's post here there is the statement:

"Conversely, if one can somehow establish a bound of the form

$$\displaystyle \sum_{n \leq x} \Lambda(n) = x + O( x^{1/2+\epsilon} ) \tag{1}$$

for any fixed ${\epsilon}$, then the explicit formula can be used to..."

I don't know about the word "fixed", but the irregular behaviour of the blue curve below gives plenty of room for an ${\epsilon}$, if it is true that the asymptotic is $(8x)^{1/2}$, and if it is also true that it bounds the partial sums of the Möbius transform of the Harmonic numbers minus $x$. But we don't know and can't conclude any such bounds from this question. I am only asking about the asymptotics of a certain sum that is connected to / a truncated absolute value version of the numerators of the expansion of the primes.

Let:

$$\varphi^{-1}(n) = \sum_{d \mid n} \mu(d)d \tag{2}$$

Then for $n>1$:

$$\Lambda(n) = \sum\limits_{k=1}^{\infty}\frac{\varphi^{-1}(\gcd(n,k))}{k} \tag{3}$$

Form the table: $$A(n,k)=\sum_{\substack{i=k\\\ n \geq k}}^n \varphi^{-1}(\gcd (i,k)) \tag{4}$$

From numerical evidence it appears that:

$$\sum _{k=1}^{x} \text{sgn}\left(\left(\text{sgn}\left(x+\sum _{j=2}^k -|A(x,j)|\right)+1\right)\right)+1 \sim (8x)^{1/2} \tag{5}$$

Is it true or is the asymptotic something else?

Question:

The complicated sign formula in $(5)$ comes from what we are really doing which is to ask: What is the asymptotic of the least $k$ for which the function $F(x)$:

$$F(x)=x+\sum _{j=2}^k -|A(x,j)| \tag{6}$$

is negative? For $k=1..x$.

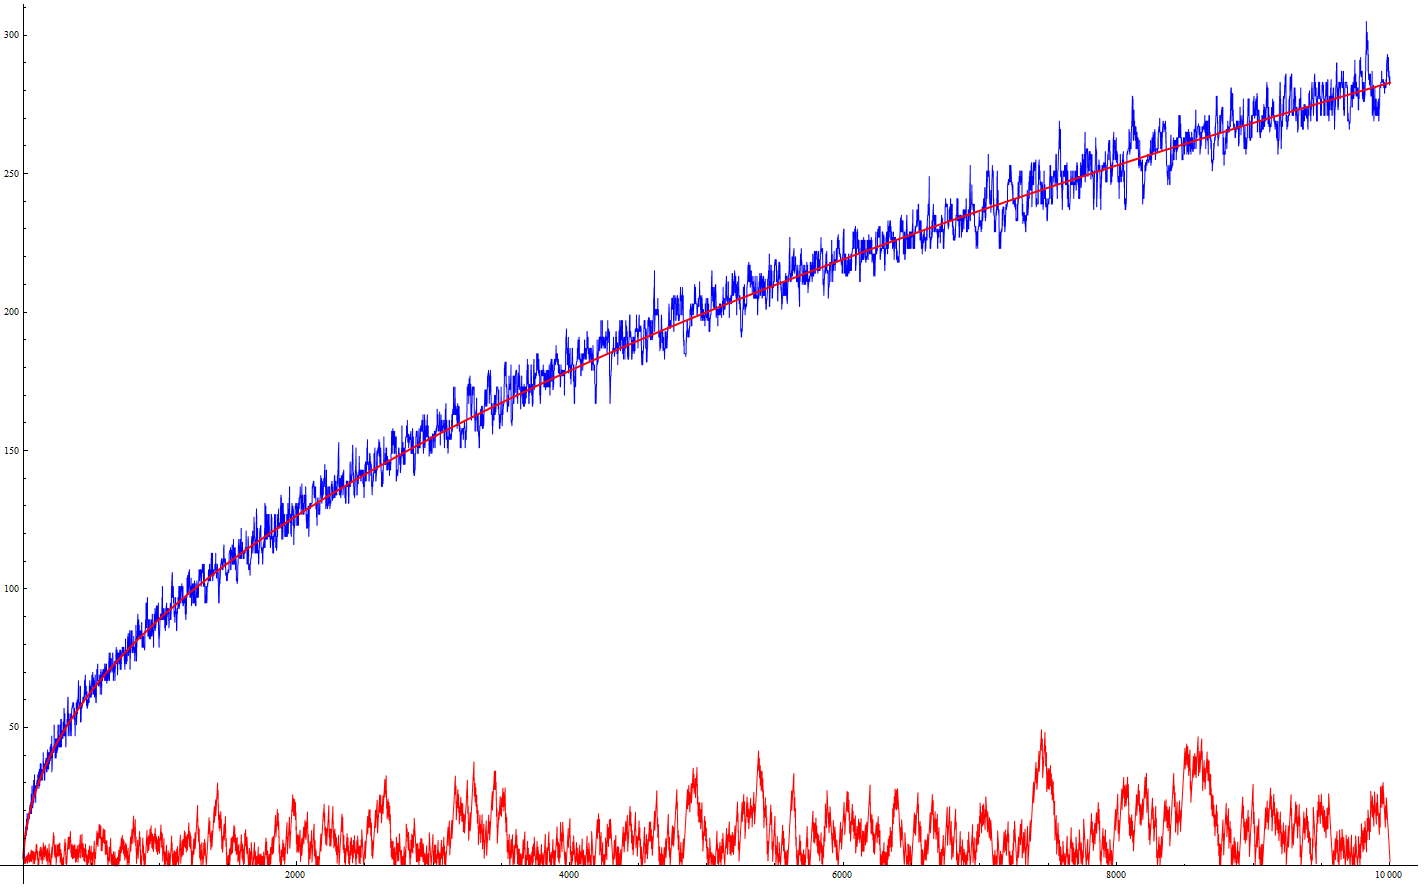
Plot of the numerical evidence where the irregular blue curve is that least $k$ for which the function $F(x)$ is negative and thereby also the LHS of (5) while the smooth red curve is the conjectured asymptotic $(8x)^{1/2}$:

what asymptotics sqrt 8x

Efficient Mathematica program to generate the plot. Setting nn=10000 gives the plot above:

(*start*)
(*Mathematica*)
Clear[a, f, p];
nn = 1000;
p = 0;
f[n_] := n*Log[n]^p;
(*Clear[f];*)
(*f[n_] := n*Log[n]^4/(Pi*8)^2/8;*)
a[n_] := DivisorSum[n, MoebiusMu[#] # &];
Monitor[TableForm[
   A = Accumulate[
     Table[Table[If[n >= k, a[GCD[n, k]], 0], {k, 1, nn}], {n, 1, 
       nn}]]];, n]
TableForm[B = -Abs[A]];
Clear[A];
B[[All, 1]] = N[Table[f[n], {n, 1, nn}]];
TableForm[B];
TableForm[B1 = Sign[Transpose[Accumulate[Transpose[B]]]]];
Clear[B];
Quiet[Show[
  ListLinePlot[
   v = ReplaceAll[
     Flatten[Table[First[Position[B1[[n]], -1]], {n, 1, nn}]], 
     First[{}] -> 1], PlotStyle -> Blue], 
  Plot[Sqrt[8*f[n]], {n, 1, nn}, PlotStyle -> {Red, Thick}], 
  ImageSize -> Large]]
ListLinePlot[v/Table[Sqrt[8*f[n]], {n, 1, nn}]]
(*end*)

Variant of the Mathematica program above: https://pastebin.com/GJ81MQez

Inefficient Mathematica program to generate the LHS in (5):

Clear[varphi];
nn = 20;
constant = 2*Sqrt[2];
varphi[n_] := Total[Divisors[n]*MoebiusMu[Divisors[n]]];
Monitor[TableForm[
   A = Table[
     Table[Sum[If[n >= k, varphi[GCD[i, k]], 0], {i, k, n}], {k, 1, 
       nn}], {n, 1, nn}]];, n]
Table[1 + 
  Sum[Sign[(1 + Sign[x + Sum[-Abs[A[[x, j]]], {j, 2, k}]])], {k, 1, 
    x}], {x, 1, nn}]

which starts: {2, 3, 4, 5, 6, 5, 7, 7, 10, 7, 11, 10, 11, 10, 11, 11, 14, 13, 14, 13}

For my own memory to remember where to start editing tomorrow I write this Mathematica program:

Clear[varphi];
nn = 40;
varphi[n_] := Total[Divisors[n]*MoebiusMu[Divisors[n]]];
Table[1 + 
  Sum[Sign[(1 + 
      Sign[x + 
        Sum[-Abs[
           Sum[If[x >= j, varphi[GCD[i, j]], 0], {i, j, x}]], {j, 2, 
          k}]])], {k, 1, x}], {x, 1, nn}]

There are previous efforts related to this question. Here is one of them.

A construction: $$\sqrt{x} \log ^2(x)=\sqrt{x} \left(x-\left(\sqrt{x}-\log (x)\right) \left(\sqrt{x}+\log (x)\right)\right)$$

$\endgroup$
6
  • $\begingroup$ Proof of von Mangoldt function formula: math.stackexchange.com/a/51708/8530, mathoverflow.net/a/162214/25104 $\endgroup$ Commented May 1, 2020 at 11:05
  • $\begingroup$ Sqrt(8) in the OEIS: oeis.org/A010466 $\endgroup$ Commented May 1, 2020 at 11:08
  • 2
    $\begingroup$ Could you say clearly if the "blue curve" represents $\sum_{n \leq x} \Lambda(n) -x$ or something else? $\endgroup$
    – YCor
    Commented May 28, 2020 at 20:11
  • $\begingroup$ The irregular blue curve is not $\sum_{n \leq x} \Lambda(n) -x$. I will try to edit and clarify. It uses negated absolute values of the terms in the same expansion as $\sum_{n \leq x} \Lambda(n)$ though. $\endgroup$ Commented May 28, 2020 at 20:33
  • 3
    $\begingroup$ You don't have to give a complicated formula with signs, you can just say "Let $F(n)$ be the least $k$ such that .... is negative" $\endgroup$
    – Will Sawin
    Commented May 28, 2020 at 21:02

3 Answers 3

12
$\begingroup$

Let us denote the left hand side of $(1)$ by $\psi(x)$. It is known that $|\psi(x)-x|$ is not bounded by a constant times $x^{1/2}$. In fact Littlewood (1914) proved that $$\psi(x)-x=\Omega_{\pm}(x^{1/2}\log\log\log x).$$ This is Theorem 15.11 in Montgomery-Vaughan: Multiplicative number theory I.

$\endgroup$
2
$\begingroup$

If one rewrites $(4)$ as: $$A(n,k)=\sum_{i=1}^n \varphi^{-1}(\gcd (i,k))$$ Then one finds empirically that the mean of the $k$-th column in $A(n,k)$ is:

$$\lim_{n\to\infty} \frac{1}{n}\sum_{k=1}^n A(n,k) = -\frac{\varphi^{-1}(k)}{2} \tag{*}$$

and that the period length of column $k$ is $k$.

In https://oeis.org/A173557 on Jun 18 2020, Vaclav Kotesovec says that the Dirichlet generating function for: $$a(k)=|\varphi^{-1}(k)|$$ is: $$\frac{\zeta(s)\zeta(s-1)}{\zeta(2s-2)} \prod_{p \text{ prime}} \left(1 - \frac{2}{(p + p^s)}\right)$$

and per email he explained to me that by choosing the residue at $s=2$ he finds that:

$$\sum_{k=1}^{n} a(k) \sim c \frac{n^2}{2}$$ or equivalently: $$\sum_{k=1}^{n} |\varphi^{-1}(k)| \sim c \frac{n^2}{2} \tag{**}$$

where: $$c = A307868 = \prod_{p \text{ prime}} \left(1-\frac{2}{(p+p^2)}\right) = 0.471680613612997868...$$

In the question above we ask what is the least $k$ for which the function $F(n)$: $$F(n)=n-\sum _{j=2}^k|A(n,j)|$$ becomes negative. Since the columns are periodic and the average of the periods in the $k$-th column is as said above: $-\frac{\varphi^{-1}(k)}{2}$, this is then approximately equal to asking what is the least $k$ for which the function $G(n)$: $$G(n)=n-\sum _{j=2}^k\frac{|\varphi^{-1}(j)|}{2} \tag{***}$$ becomes negative.

Combining $(*)$ and $(**)$: $$\sum _{j=1}^k\frac{|\varphi^{-1}(j)|}{2} \sim c\frac{k^2}{4}$$ Setting $j=2$ in the lower summation index: $$\sum _{j=2}^k\frac{|\varphi^{-1}(j)|}{2} \sim c\frac{k^2}{4}-1$$ Inserting into $(***)$:

$$G(n)=n-\left(c\frac{k^2}{4}-1\right)$$

The least $k$ for which $G(n)$ becomes negative or changes sign is when $G(n)=0$. Solving:

$$c\frac{k^2}{4} - 1 = n$$ for $k$ gives the answer:

$$k(n) = \frac{2 \sqrt{n+1}}{\sqrt{c}} = \sqrt{8.4803146 (n+1)}$$

where as the conjectured asymptotic for the least $k$ when $F(n)$ becomes negative was:

$$k(n) \sim \frac{2 \sqrt{n}}{\sqrt{\frac{1}{2}}}=\sqrt{8n}$$ for comparison.

$\endgroup$
2
  • $\begingroup$ Clear[nn, t, n, k]; b = {1, -1}; nn = 1000; a[n_] := Total[MoebiusMu[Divisors[n]]*Divisors[n]]; Monitor[ g1 = ListLinePlot[ Accumulate[ Table[Sum[ If[Mod[k, 2] == 0, 1, b[[1 + Mod[n, 2]]]]*a[GCD[n, k]]/N[k], {k, 1, n}], {n, 1, nn}]]], n]; g2 = Plot[(Log[n] - Log[2])^2*Log[2] - Log[2]/2, {n, 1, nn}, PlotStyle -> Red]; Show[g1, g2] $\endgroup$ Commented Aug 3, 2023 at 22:13
  • $\begingroup$ mathoverflow.net/q/473639/25104 $\endgroup$ Commented Jul 17 at 17:13
0
$\begingroup$

Setting:

$$F(x)=x\log(x)+\sum _{j=2}^k -|A(x,j)| \tag{1}$$

appears to give the asymptotic $\sqrt{8x\log(x)}$ for the least $k$ such that $F(x)$ is negative.

In general it appears that the least $k$ such that:

$$F(x)=f(x)+\sum _{j=2}^k -|A(x,j)| \tag{2}$$

is negative, has the asymptotic: $\sqrt{8f(x)}$.

See the Mathematica program in the question, by setting p=1.

$\endgroup$
2
  • $\begingroup$ Clear[nn, t, n, k]; nn = 1000; a[n_] := Total[MoebiusMu[Divisors[n]]*Divisors[n]]; Monitor[g1 = ListLinePlot[ Accumulate[ Table[Sum[ If[Mod[k, 2] == 0, 1, (-1)^n]*a[GCD[n, k]]/N[k], {k, 1, n}], {n, 1, nn}]]], n]; g2 = Plot[(Log[n] - Log[2])^2/(1.45), {n, 1, nn}, PlotStyle -> Red]; Show[g1, g2, PlotRange -> {0, 30}] $\endgroup$ Commented Aug 3, 2023 at 19:50
  • $\begingroup$ Monitor[g1 = ListLinePlot[ Accumulate[ Table[Sum[ If[Mod[k, 2] == 0, 1, (-1)^n]*a[GCD[n - k, k + n]]/N[k], {k, 1, n}], {n, 1, nn}]]], n] $\endgroup$ Commented Aug 3, 2023 at 19:51

You must log in to answer this question.

Not the answer you're looking for? Browse other questions tagged .