Let $a(n)$ be the Dirichlet inverse of the Euler totient function:
$$a(n) = \sum\limits_{d|n} d \cdot \mu(d) \tag{1}$$
and let the matrix $T(n,k)$ be: $$T(n,k)=a(\gcd(n,k)) \tag{2}$$
It has been proven by both joriki and GH from MO that
for $n>1$:
$$\Lambda(n) = \sum\limits_{k=1}^{\infty}\frac{T(n,k)}{k} \tag{3}$$
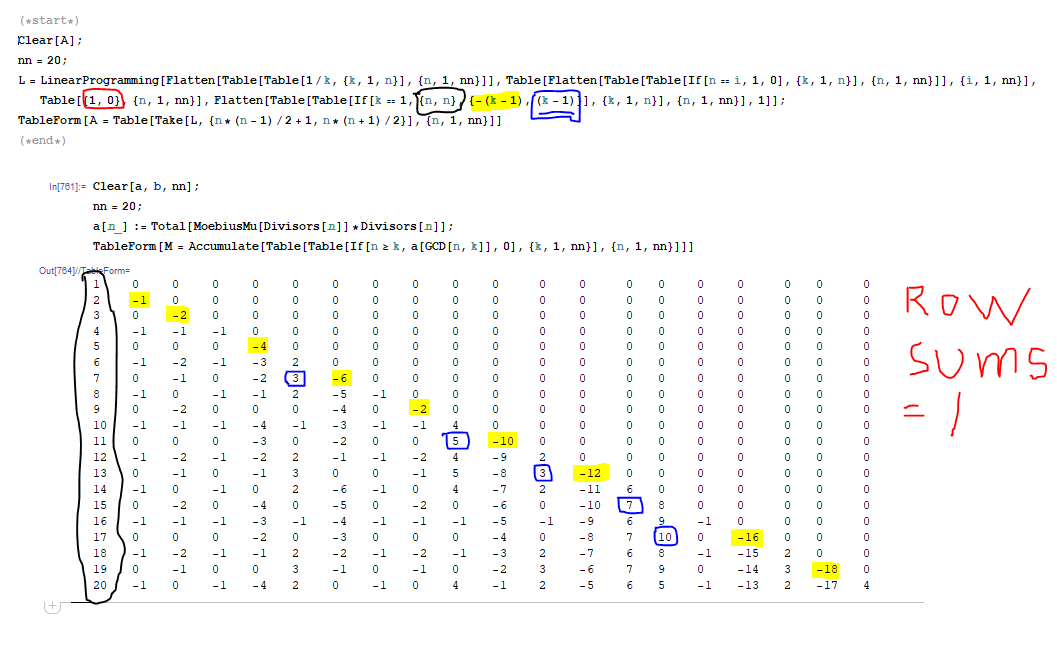
Let $M(n,k)$ be the lower triangular matrix:
$$M(n,k)=\underset{m\geq k}{\sum _{m=1}^n} a(\gcd (m,k)) \tag{4}$$
Conjecture 1: For $1 < k \leq n$, for all $n$: $$\;\;\;\;-(k-1) \leq M(n,k) \leq (k-1)$$ Conjecture 2: $$ \sum_{k=1}^{k=n} M(n,k) = 1$$
$$\sum _{k=2}^n \frac{M(n,k)}{k}=\sum _{m=1}^n \left(\underset{k \mid m}{\sum _{k=1}^m} H_k \mu \left(\frac{m}{k}\right)-1\right) \tag{5}$$
I am interested in investigating:
$$\sum _{k=2}^x \frac{M(x,k)}{k} < C\left\lfloor x^{1/2+\epsilon}+\frac{1}{2}\right\rfloor \tag{6}$$
Therefore we form the linear programming problem $(7)$:
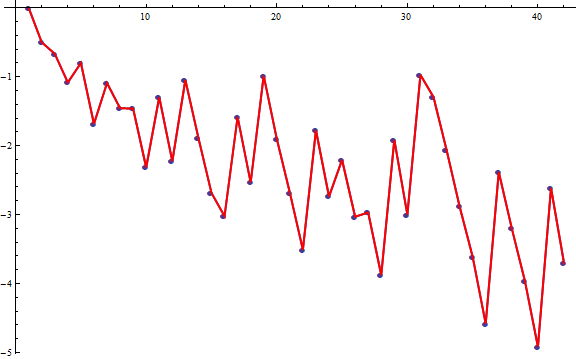
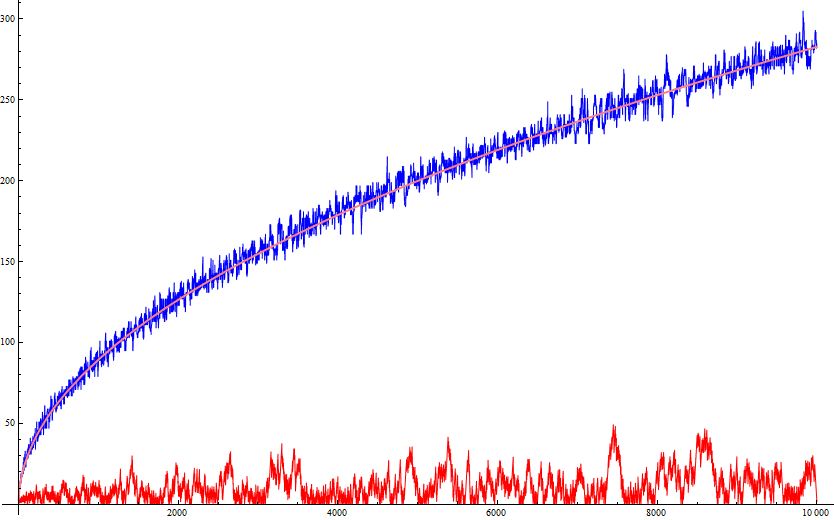
$$\begin{array}{ll} \text{minimize} & \displaystyle\sum_{k=1}^{k=n} \frac{y_{k}}{k} \\ \text{subject to constraints:} & n + \displaystyle\sum_{k=2}^{k=n}y_{k}=1 \\ & y_1 \geq -1 \\ \text{and for $k>1$:} & M(n,k) \leq y_k \leq M(n,k) & \tag{7} \end{array}$$ The solution to the linear programming problem $(7)$ (blue dots) will automatically coincide with LHS of $(6)$ (the red lines) as shown in this graph:
Because of the answer to this question here proven by Marcus Ritt and the other parallell answer here by Maxim, I find it natural to ask whether the output (the blue lines) from the following linear programming problem $(8)$ is greater than $(7)$. In the program I made the change that I put the upper variable bound to $0$ and the lower variable bound to the negated absolute value of the entries in the lower triangular matrix $M(n,k)$.
$$\begin{array}{ll} \text{minimize} & \displaystyle\sum_{k=1}^{k=n} \frac{y_{k}}{k} \\ \text{subject to constraints:} & n + \displaystyle\sum_{k=2}^{k=n}y_{k}=1 \\ & y_1 \geq -1 \\ \text{and for $k>1$:} & -|M(n,k)| \leq y_k \leq 0 & \tag{8} \end{array}$$
Can anything be said whether there exist a constant $C$ such that:
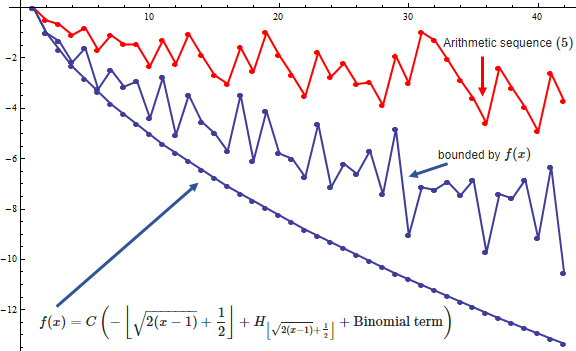
$C$ times the output from LP-problem $(8)$ $\geq$ The output from LP-problem $(7)$?Or put in pictures. Is there a constant $C$ such that the irregular red curve is bounded by the irregular blue curve? That for $C$, however large, say $C=1000$ or greater.
What we do know given conjecture 1 above which implies that $-|M(n,k)| \geq -(k-1)$, is that the wiggly blue curve below is bounded by the smooth continuous blue curve $f(x)$:
From the answer at the operations research forum we also know that the solutions to the linear programming problem:
$$\begin{array}{ll} \text{minimize} & \displaystyle\sum_{k=1}^{k=n} \frac{y_{k}}{k} \\ \text{subject to constraints:} & n + \displaystyle\sum_{k=2}^{k=n}y_{k}=1 \\ & y_1 \geq -1 \\ \text{and for $k>1$:} & -(k-1) \leq y_k \leq 0 & \tag{9} \end{array}$$
is the continuous blue curve $f(x)$ and it is asymptotic to:
$$f(x)=C\left(-\left\lfloor \sqrt{2 (x-1)}+\frac{1}{2}\right\rfloor +H_{\left\lfloor \sqrt{2 (x-1)}+\frac{1}{2}\right\rfloor } + \text{Binomial term} \right) \tag{10}$$
($C=2$ was multiplied with later). Anyways, the the solutions to $(8)$ are always bounded by the solutions to $(9)$. The question is whether the solutions to $(7)$ are bounded by the solutions to $(8)$?
The binomial term can be found in the OEIS.
Edit: Minor error: $f(x)$ should have been $f(n)$ to suit the linear programming problem.
The answer, if it is to be found, lies in comparing this matrix from the solution of the Linear Programming tagged $(8)$ starting:
$$\begin{array}{llllllllllllllllll} 1 & \text{} & \text{} & \text{} & \text{} & \text{} & \text{} & \text{} & \text{} & \text{} & \text{} & \text{} & \text{} & \text{} & \text{} & \text{} & \text{} & \text{} \\ 1 & -1 & \text{} & \text{} & \text{} & \text{} & \text{} & \text{} & \text{} & \text{} & \text{} & \text{} & \text{} & \text{} & \text{} & \text{} & \text{} & \text{} \\ 1 & 0 & -2 & \text{} & \text{} & \text{} & \text{} & \text{} & \text{} & \text{} & \text{} & \text{} & \text{} & \text{} & \text{} & \text{} & \text{} & \text{} \\ 1 & -1 & -1 & -1 & \text{} & \text{} & \text{} & \text{} & \text{} & \text{} & \text{} & \text{} & \text{} & \text{} & \text{} & \text{} & \text{} & \text{} \\ 1 & 0 & 0 & 0 & -4 & \text{} & \text{} & \text{} & \text{} & \text{} & \text{} & \text{} & \text{} & \text{} & \text{} & \text{} & \text{} & \text{} \\ 1 & -1 & -2 & -1 & -1 & 0 & \text{} & \text{} & \text{} & \text{} & \text{} & \text{} & \text{} & \text{} & \text{} & \text{} & \text{} & \text{} \\ 1 & 0 & -1 & 0 & -2 & -3 & 0 & \text{} & \text{} & \text{} & \text{} & \text{} & \text{} & \text{} & \text{} & \text{} & \text{} & \text{} \\ 1 & -1 & 0 & -1 & -1 & -2 & -2 & 0 & \text{} & \text{} & \text{} & \text{} & \text{} & \text{} & \text{} & \text{} & \text{} & \text{} \\ 1 & 0 & -2 & 0 & 0 & 0 & -4 & 0 & -2 & \text{} & \text{} & \text{} & \text{} & \text{} & \text{} & \text{} & \text{} & \text{} \\ 1 & -1 & -1 & -1 & -4 & -1 & -1 & 0 & 0 & 0 & \text{} & \text{} & \text{} & \text{} & \text{} & \text{} & \text{} & \text{} \\ 1 & 0 & 0 & 0 & -3 & 0 & -2 & 0 & 0 & -5 & 0 & \text{} & \text{} & \text{} & \text{} & \text{} & \text{} & \text{} \\ 1 & -1 & -2 & -1 & -2 & -2 & -1 & -1 & -1 & 0 & 0 & 0 & \text{} & \text{} & \text{} & \text{} & \text{} & \text{} \\ 1 & 0 & -1 & 0 & -1 & -3 & 0 & 0 & -1 & -5 & -1 & 0 & 0 & \text{} & \text{} & \text{} & \text{} & \text{} \\ 1 & -1 & 0 & -1 & 0 & -2 & -6 & -1 & 0 & -2 & 0 & 0 & 0 & 0 & \text{} & \text{} & \text{} & \text{} \\ 1 & 0 & -2 & 0 & -4 & 0 & -5 & 0 & -2 & 0 & -1 & 0 & 0 & 0 & 0 & \text{} & \text{} & \text{} \\ 1 & -1 & -1 & -1 & -3 & -1 & -4 & -1 & -1 & -1 & -1 & 0 & 0 & 0 & 0 & 0 & \text{} & \text{} \\ 1 & 0 & 0 & 0 & -2 & 0 & -3 & 0 & 0 & 0 & -4 & 0 & -7 & 0 & 0 & 0 & 0 & \text{} \\ 1 & -1 & -2 & -1 & -1 & -2 & -2 & -1 & -2 & -1 & -3 & -1 & 0 & 0 & 0 & 0 & 0 & 0 \end{array}$$
with the matrix from the solution of the Linear Programming tagged $(7)$ which essentially is the matrix $M$ except for the first column, starting: $$\begin{array}{llllllllllllllllll} 1 & \text{} & \text{} & \text{} & \text{} & \text{} & \text{} & \text{} & \text{} & \text{} & \text{} & \text{} & \text{} & \text{} & \text{} & \text{} & \text{} & \text{} \\ 1 & -1 & \text{} & \text{} & \text{} & \text{} & \text{} & \text{} & \text{} & \text{} & \text{} & \text{} & \text{} & \text{} & \text{} & \text{} & \text{} & \text{} \\ 1 & 0 & -2 & \text{} & \text{} & \text{} & \text{} & \text{} & \text{} & \text{} & \text{} & \text{} & \text{} & \text{} & \text{} & \text{} & \text{} & \text{} \\ 1 & -1 & -1 & -1 & \text{} & \text{} & \text{} & \text{} & \text{} & \text{} & \text{} & \text{} & \text{} & \text{} & \text{} & \text{} & \text{} & \text{} \\ 1 & 0 & 0 & 0 & -4 & \text{} & \text{} & \text{} & \text{} & \text{} & \text{} & \text{} & \text{} & \text{} & \text{} & \text{} & \text{} & \text{} \\ 1 & -1 & -2 & -1 & -3 & 2 & \text{} & \text{} & \text{} & \text{} & \text{} & \text{} & \text{} & \text{} & \text{} & \text{} & \text{} & \text{} \\ 1 & 0 & -1 & 0 & -2 & 3 & -6 & \text{} & \text{} & \text{} & \text{} & \text{} & \text{} & \text{} & \text{} & \text{} & \text{} & \text{} \\ 1 & -1 & 0 & -1 & -1 & 2 & -5 & -1 & \text{} & \text{} & \text{} & \text{} & \text{} & \text{} & \text{} & \text{} & \text{} & \text{} \\ 1 & 0 & -2 & 0 & 0 & 0 & -4 & 0 & -2 & \text{} & \text{} & \text{} & \text{} & \text{} & \text{} & \text{} & \text{} & \text{} \\ 1 & -1 & -1 & -1 & -4 & -1 & -3 & -1 & -1 & 4 & \text{} & \text{} & \text{} & \text{} & \text{} & \text{} & \text{} & \text{} \\ 1 & 0 & 0 & 0 & -3 & 0 & -2 & 0 & 0 & 5 & -10 & \text{} & \text{} & \text{} & \text{} & \text{} & \text{} & \text{} \\ 1 & -1 & -2 & -1 & -2 & 2 & -1 & -1 & -2 & 4 & -9 & 2 & \text{} & \text{} & \text{} & \text{} & \text{} & \text{} \\ 1 & 0 & -1 & 0 & -1 & 3 & 0 & 0 & -1 & 5 & -8 & 3 & -12 & \text{} & \text{} & \text{} & \text{} & \text{} \\ 1 & -1 & 0 & -1 & 0 & 2 & -6 & -1 & 0 & 4 & -7 & 2 & -11 & 6 & \text{} & \text{} & \text{} & \text{} \\ 1 & 0 & -2 & 0 & -4 & 0 & -5 & 0 & -2 & 0 & -6 & 0 & -10 & 7 & 8 & \text{} & \text{} & \text{} \\ 1 & -1 & -1 & -1 & -3 & -1 & -4 & -1 & -1 & -1 & -5 & -1 & -9 & 6 & 9 & -1 & \text{} & \text{} \\ 1 & 0 & 0 & 0 & -2 & 0 & -3 & 0 & 0 & 0 & -4 & 0 & -8 & 7 & 10 & 0 & -16 & \text{} \\ 1 & -1 & -2 & -1 & -1 & 2 & -2 & -1 & -2 & -1 & -3 & 2 & -7 & 6 & 8 & -1 & -15 & 2 \end{array}$$
Associated Mathematica program: https://pastebin.com/rHaXxVcj
Edit: 25.11.2019:
I am not entirely sure but I believe the question approximately boils down to:
Let: $a(n)=\sum\limits_{d \mid n} \mu(d)d$
Prove or disprove that there exists a constant $c$ such that the inequality: $$\sum\limits_{r=2}^{n} \frac{\sum\limits_{m=r}^{n} a(\gcd (m,r))}{r} \geq c\underset{\sum\limits_{k=2}^{r} -\left|\sum\limits_{m=k}^{n} a(\gcd (m,k))\right|\geq -(n-1)}{\sum _{r=2}^n} -\frac{\left|\sum\limits_{m=r}^{n} a(\gcd (m,r))\right|}{r} \tag{11}$$
holds for all $n$
I am asking because it has been proven that the right hand side is bounded from below by:
$$c\left(-\left\lfloor \sqrt{2 (n-1)}+\frac{1}{2}\right\rfloor +H_{\left\lfloor \sqrt{2 (n-1)}+\frac{1}{2}\right\rfloor } + \text{Binomial term} \right)$$
Mathematica:
Clear[a, b, nn];
nn = 60;
a[n_] := Total[MoebiusMu[Divisors[n]]*Divisors[n]];
Monitor[a1 =
   Table[Sum[Sum[a[GCD[m, r]], {m, r, n}]/r, {r, 2, n}], {n, 1,
     nn}];, n]
g1 = ListLinePlot[a1, PlotStyle -> {Red, Thick}];
Monitor[a2 =
   Table[Sum[
     If[Sum[-Abs[Sum[a[GCD[m, k]], {m, k, n}]], {k, 2,
         r}] >= -(n - 1), -Abs[Sum[a[GCD[m, r]], {m, r, n}]]/r,
      0], {r, 2, n}], {n, 1, nn}];, n]
g2 = ListLinePlot[a2, PlotStyle -> {Thick}];
Show[g2, g1]
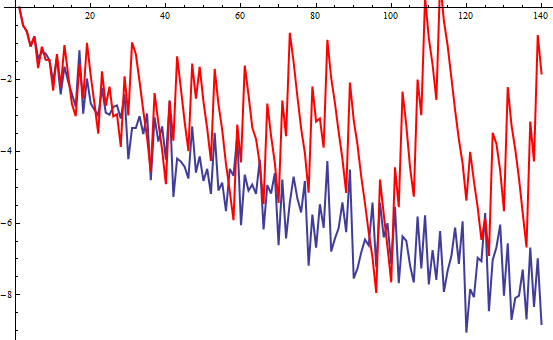
It is as said conjectured that the blue curve times a constant is greater than the red curve. The blue curve is bounded from below by a function whose leading term is the floor function of a square root.
Same graph as above but for a 1000 times 1000 sized matrix:
Edit 30.4.2020: More efficient program and plot:
(*start*)
(*Mathematica*)
Clear[a];
nn = 2000;
constant = 2*Sqrt[2];
a[n_] := Total[Divisors[n]*MoebiusMu[Divisors[n]]];
Monitor[TableForm[
   A = Accumulate[
     Table[Table[If[n >= k, a[GCD[n, k]], 0], {k, 1, nn}], {n, 1,
       nn}]]];, n]
TableForm[AB = Transpose[A]/Range[nn]];
AB[[1, All]] = 0;
g1 = ListLinePlot[Abs[Total[AB]], PlotStyle -> Red];
Clear[AB];
TableForm[B = -Abs[A]];
Clear[A];
B[[All, 1]] = Range[nn];
TableForm[B1 = Sign[Transpose[Accumulate[Transpose[B]]]]];
Clear[B]
Quiet[Show[
  ListLinePlot[
   v = ReplaceAll[
     Flatten[Table[First[Position[B1[[n]], -1]], {n, 1, nn}]],
     First[{}] -> 1], PlotStyle -> Blue],
  Plot[constant*Sqrt[n], {n, 1, nn}, PlotStyle -> {Pink, Thick}], g1,
  ImageSize -> Large]]
ListLinePlot[v/(constant*Sqrt[Range[nn]])];
(*end*)
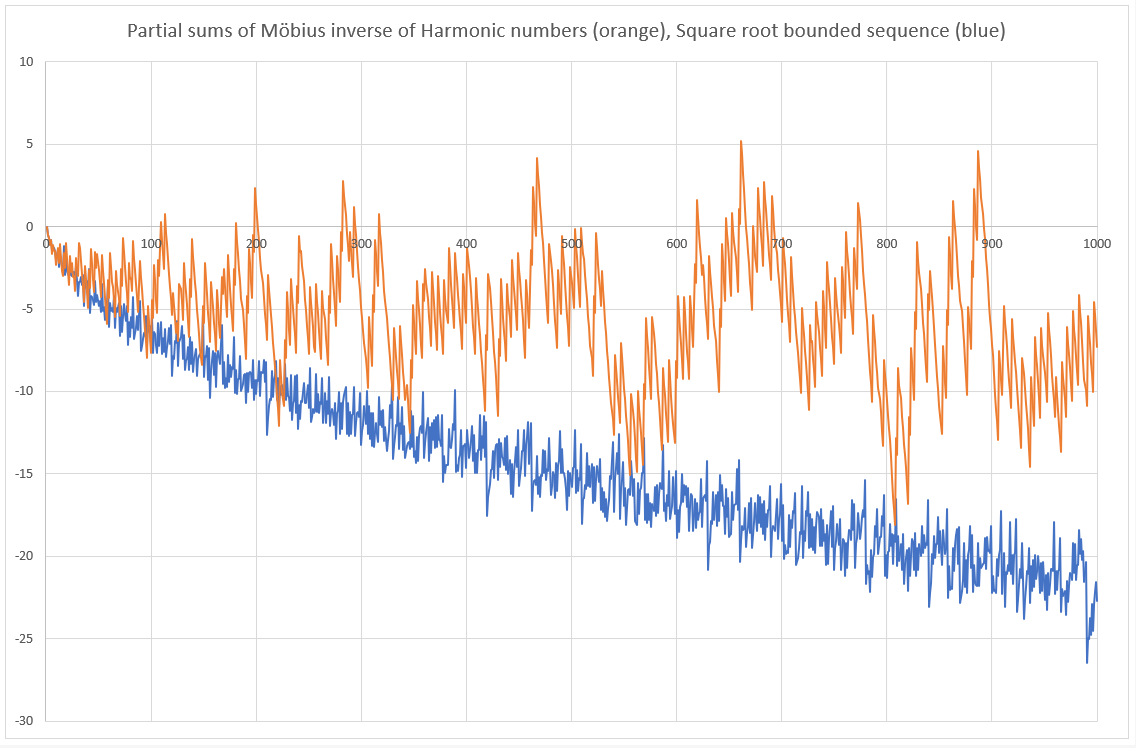
The pink curve is 2*Sqrt(2)*Sqrt(x):

