12
$\begingroup$

Let's assume $x\in[0,1]$, and restrict all functions of $x$ that we consider to this domain. Consider a sequence $\mathcal S_n$ of sets of functions, where $n^{\text{th}}$ element is the set of all functions constructed from $n$ instances of the variable $x$ using exponentiation and parentheses. For example, $$\small \color{gray}{\mathcal S_1=}\left\{x\right\}\color{gray}{,\quad\mathcal S_2=}\left\{x^x\right\}\color{gray}{,\quad\mathcal S_3=}\left\{x^{x^x},\left(x^x\right)^x\right\}\color{gray}{,\quad\mathcal S_4=}\left\{x^{x^{x^x}},x^{\left(x^x\right)^x},\left(x^x\right)^{x^x},\left(\left(x^x\right)^x\right)^x\right\}\color{gray}{,}\\\small\color{gray}{\mathcal S_5=}\left\{x^{x^{x^{x^x}}},x^{x^{\left(x^x\right)^x}},x^{\left(x^x\right)^{x^x}},x^{\left(\left(x^x\right)^x\right)^x},\left(x^x\right)^{x^{x^x}},\left(x^x\right)^{\left(x^x\right)^x},\left(x^{x^x}\right)^{x^x},\left(\left(x^x\right)^x\right)^{x^x},\left(\left(\left(x^x\right)^x\right)^x\right)^x\right\}\color{gray}{,\,\text{etc.}}$$ Note that different parenthesizations can still result in functions that are identical on $[0,1]$ — we consider them as the same function (it appears in the set only once). The cardinality of elements $\left|\mathcal S_n\right|$ is counted by the $\small\text{OEIS}$ sequence $A000081$, which has been studied pretty well.

We assume that the value of a function at $x=0$ is the right limit of the corresponding expression for $x\to0^+$ (the limit can be either $0$ or $1$, the numbers of each outcome are counted by the $\small\text{OEIS}$ sequences $A222379$, $A222380$). This is equivalent to assuming $0^0=1$.

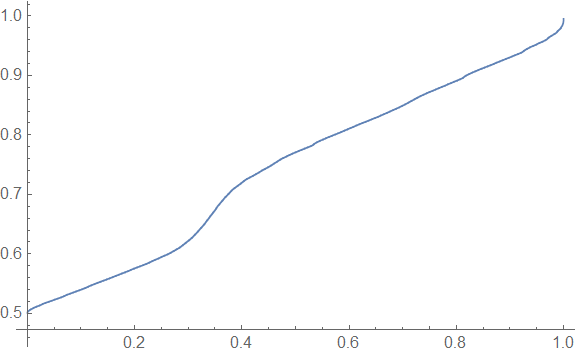
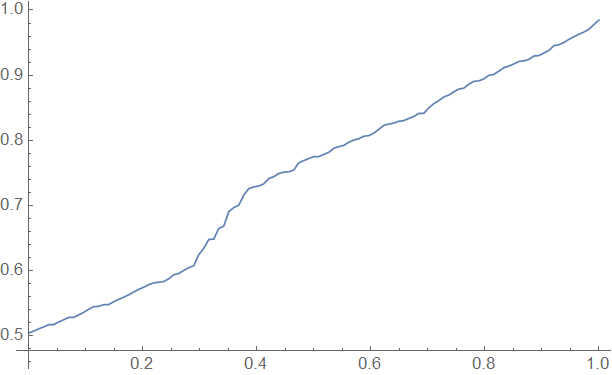
For each set $\mathcal S_n$ I integrated each function in it on $[0,1]$, sorted the list of results by magnitude and plotted them (indexes of the list were rescaled to fit on $[0,1]$, and discrete points connected by a polygonal chain). It appears that as $n$ grows, the graph starts looking "smoother" and converges to a certain curve. For example, for $n=8$ the graph looks like this:

The graph for n=8

And for $n=15$ it looks like this:

The graph for n=15

Can we (dis-)prove that the sequence of graphs indeed converges everywhere on $[0,1]$? If so, is the limiting curve continuous? Is it smooth?

$\endgroup$
1
  • 1
    $\begingroup$ Do you see those small notches on the upper part of the curve? Apparently, they do not disappear even for larger $n$. Plots look pretty much identical for all $n\ge14$. $\endgroup$ Commented Feb 27, 2019 at 17:12

1 Answer 1

1
$\begingroup$

More a comment than an answer: The curve will always be increasing (by construction!) from the lower limit of $0.5 = \lim_{n\to\infty} J(f_n)$ to the upper limit of $1 = \lim_{n\to\infty} J(g_n)$, where $J(f) := \int_0^1 f(x) \,{\rm d}x$, and the smallest and largest functions are

$f_n(x) = x^{(...(x^x)...)^x} = x^{x^{x^{n-2}}} \longrightarrow x^{x^0} = x$, resp.

$g_n(x) = (...((x^x)^x)...)^x = x^{x^{n-1}} \longrightarrow x^0 = 1 $.

Now if the number of $x$'s increases, this will insert (many) additional "intermediate" points, which may shift the graph to the right or (possibly) to the left, depending on the region. It is reasonable to expect that, if in a given region more points are inserted than in another region, then the same will be the case when $n$ is further increased. From this it follows that in a given region, the (interpolated) graph will monotonically decrease (or possibly increase) as $n$ increases.

However it turns out that the number of intermediate points inserted when going from $n$ to $n+1$, is roughly the same everywhere. With some more rigor added (e.g., one could show that replacing a generic "x" somewhere inside the expression by "(x^x)" will not significantly change the value of the integral), this could explain that the shape will remain roughly the same.

However in contrast to what it looks like, the graph for n=15 is not a simple "refinement" of the graph for n=8. Indeed, we can check that the values for all $t < 0.5$ are significantly decreasing, and the same is the case around $t = 0.8$. (I use $t$ for the abscissa of the graphs, which has no relation to the variable $x\in[0,1]$ in the expressions and integrals.)

I think that the limiting curve will be smooth except near $t=1$ where the "kink" will become sharper and sharper, i.e. the derivative of the limiting curve near $t=1$ (where the upper limit of 1 is approached by $J(g_n)$) will tend to $+\infty$.(*)

PS: We owe a very nice plot of the set of all possible functions for n=8 to Alois Heinz, see https://oeis.org/A222379/a222379.jpg . This plot shows that the set of all functions can be divided in two subsets, on one hand those with limit 0 as $x\to0$ (about 1/3 of the functions), and on the other hand those with limit 1 as $x\to0$ (about 2/3 of the functions), which can again be sub-divided in two subsets of roughly same size, depending on their slope at $x=0$ which is either 0 or significantly negative (less than -4 as it seems).

(*) ADDENDUM: The next-to-largest value is obtained for $h_n(x) = (...(x^x)^x...)^{x^x} = (x^{x^{n-3}})^{x^x} = x^{x^{n-3} x^x} = x^{x^{n-3+x}}$. This $J(h_n)$ also tends to 1 as $n\to\infty$. However, whether we estimate the slope near $t=1$ by $1 - J(g_n)$ divided by $\delta_n=1/\#S_n$ or by $J(g_n) - J(h_n)$ divided by $\delta_n$, we find that this tends to infinity (one has $\delta_n/\delta_{n+1}\gtrsim 2.9$), so the limiting graph is not smooth at $t=1$ in the sense that the slope will be infinite.

$\endgroup$
5
  • 1
    $\begingroup$ I don't see why the curve will be strictly increasing. Firstly, there may be parenthesisations which lead to distinct funtions which nevertheless have equal integrals. Further, even if we somehow prove this is not so, it may be that the limiting function is constant on some interval. $\endgroup$
    – Wojowu
    Commented Mar 1, 2019 at 14:11
  • $\begingroup$ The curve is increasing by construction: it results from sorting all possible values of the integral in increasing order! $\endgroup$
    – Max
    Commented Mar 1, 2019 at 14:20
  • $\begingroup$ You sound like you haven't read my comment. I have pointed out that there may be repeated elements in the list of integrals, which would mean the elements are merely nondecreasing, not necessarily strictly increasing. And that still doesn't say anything about the limiting curve. $\endgroup$
    – Wojowu
    Commented Mar 1, 2019 at 14:23
  • 1
    $\begingroup$ No, it's not enough. Suppose we had set of values $0/n^2,1/n^2,\dots,n/n^2$. The list contains no repetitions, yet the limiting curve is everywhere $0$. $\endgroup$
    – Wojowu
    Commented Mar 1, 2019 at 14:38
  • $\begingroup$ Yes I agree. (I have deleted the word "strictly". When I say "shifted to the left", I allow for a shift of distance 0.) But I think it is possible to show that for any (a,b) with 0.5 < a < b < 1, there is a positive lower bound on the fraction of all values which are in [a,b], for n large enough. $\endgroup$
    – Max
    Commented Mar 1, 2019 at 14:53

You must log in to answer this question.

Not the answer you're looking for? Browse other questions tagged .