[Please allow me a note: The way desribed below allows to depict functions $f:X^2 \rightarrow Y$ completely in two dimensions (without hiding or omitting any information). This allows for depicting functions $f:X^3 \rightarrow Y$ in three dimensions which otherwise might be hard to achieve.]
In the general context of Numbers and Geometry I was playing around with geometric visualizations of structures in the natural numbers and came up with a type of function graphs I haven't seen before. I'd like to know if they have been investigated before, under which name and what can be learned from them (by seeing some geometric patterns and symmetries that were not visible otherwise).
I call these function graphs line graphs. They are defined for arbitrary functions $f:X\times X \rightarrow Y$ with $X,Y = \mathbb{N},\mathbb{Z},\mathbb{Q},\mathbb{R}$ and are created by drawing a line from each point in $X\times X$ to the points $(f(x,y),0)$ and $(0,f(x,y))$.
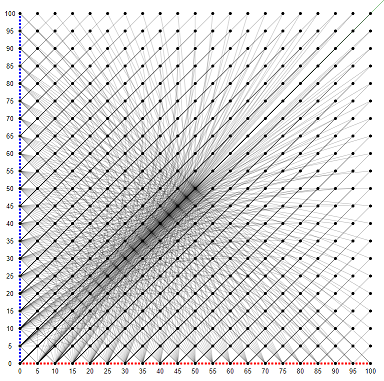
This is how the line graph for $f(x,y) = xy$ looks like (in different resolutions):
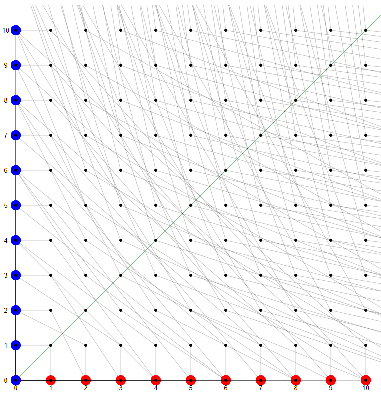
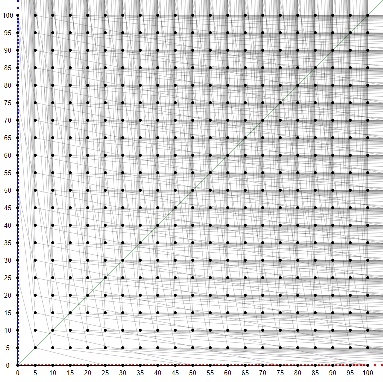
We see a maybe astonishing pattern emerge: a square grid (that might be typical for multiplication-like functions). (Note that the prime numbers are exactly those nodes on the x- resp. y-axis with degree 2.)
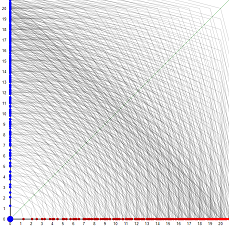
Other line graphs look quite different, of course:
(Can you guess at a glance which function's line graph this is?)
Which properties of a function can be read off the geometrical patterns (symmetries) of its line graph - and how? The other way around: Which geometrical patterns (symmetries) can be predicted just by looking at the definition of a function $f$? (First of all: The pattern is symmetric when the function is symmetric.)
[If you like to play around with line graphs you can do it here.]
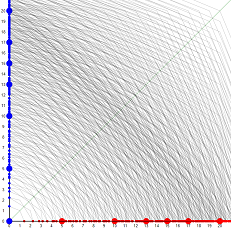
Added: I added two functions to plot: $f_2(x,y) = \sqrt{x^2 + y^2}$ and $f_3(x,y) = \sqrt[3]{x^3 + y^3}$. The fat red circles on the x-axis indicate integer values. (Fermat's last theorem says, that $f_3$ doesn't take integer values, which can be seen.)
Related question: By construction of line graphs, every function $f$ has a "reverse" function $f^*$ associated to it, which is defined by the point at which the line going through $(x,y)$ and $(f(x,y),0)$ crosses the y-axis, which is by definition at $(0,f^*(x,y))$.
We have $f^*(x,y) = \frac{f(x,y)\times y}{f(x,y) - x}$ and $f(x,y) = \frac{f^*(x,y)\times x}{f^*(x,y) - y}$
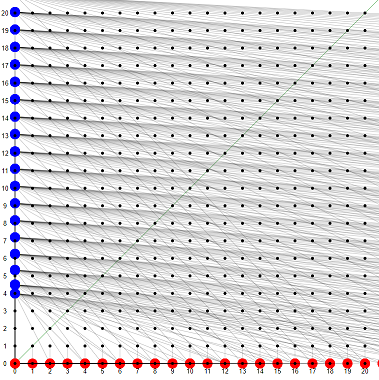
For $f(x,y) = x y$, we have $f^*(x,y) = y^2/(y-1)$ (which by the way does not depend on $x$):
Has this construction of an associated function $f^*$ been investigated before? Might it be interesing to investigate the relationship between $f$ and $f^*$?

