Let $C_n$ denote the (random) size of the maximum cycle in a (uniform) simple random 2-regular graph on $n$ (labeled) vertices; $\langle C_n\rangle$ will denote its expectation value.
No theorems below, but here are the results of some experiments performed with SageMath (code below); they seem to suggest $\langle C_n\rangle\approx 0.76 n$, in line with Richard Stanley's first comment above. I can't be sure whether the values of $n$ I considered were large enough, so caveat lector!
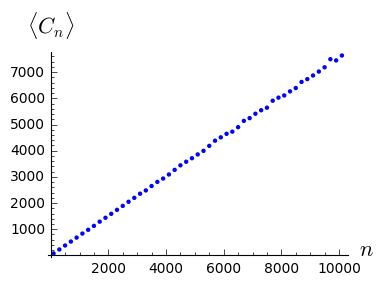
I generated $10^4$, 5000 and 1000 random 2-regular graphs of size $n$ using SageMath's graphs.RandomRegular function (see link for citations for the algorithm) for $100\leq n<1000$, $1000\leq n<5000$, $5000\leq n\leq10100$, respectively. The above figure shows the mean size of the largest component as a function of $n$.
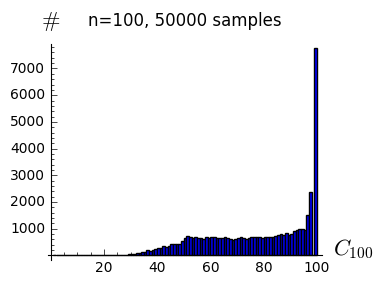
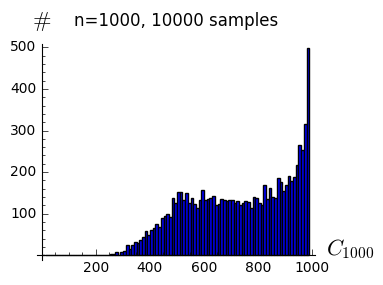
Next, I show the number of occurrences of each value of $C_n$ (an estimated probability distribution function) in the sampled $n$-vertex random graphs.
For $n=100$:
For $n=1000$:
For $n=10000$:
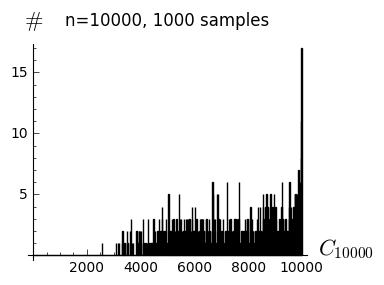
In all cases, there is a relatively large spike at $C_n=n$, and 0 occurrences of $C_n=n-1,n-2$ (since the graphs must be simple); this isn't always visible in the plots above due to the binning.
Since a large fraction of the distribution seemed to be concentrated at $n$, I also decided to check the probability $P_n$ of the event $C_n=n$. Here's a log-log plot:
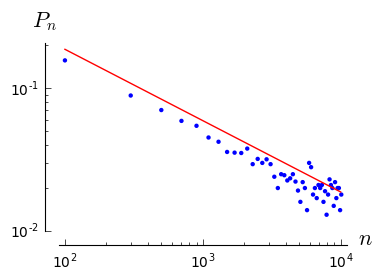
Brendan McKay has commented that his technique shows that $P_n=(1+o(1))e^{3/4}\sqrt{\frac{\pi}{4n}}$ (drawn in red).
Code:
runs=1000
means = [0]*51
nummax = [0]*51
numruns = [0]*51

for ind,n in enumerate(range(100,10101,200)):
    runs = 1000
    if n < 5000:
        runs = 5000
    if n < 1000:
        runs = 10000
    data = [0]*runs
    for j in range(runs):
        G = graphs.RandomRegular(2,n)
        data[j] = G.connected_components_sizes()[0]
    numruns[ind] = runs
    means[ind] = mean(data)
    nummax[ind] = len([k for k in range(len(data)) if data[k]==n])


