27
$\begingroup$

(This is based on an earlier MSE posting, "Structures in the plot of the “squareness” of numbers.")


My main question is to explain the structural features of this plot:
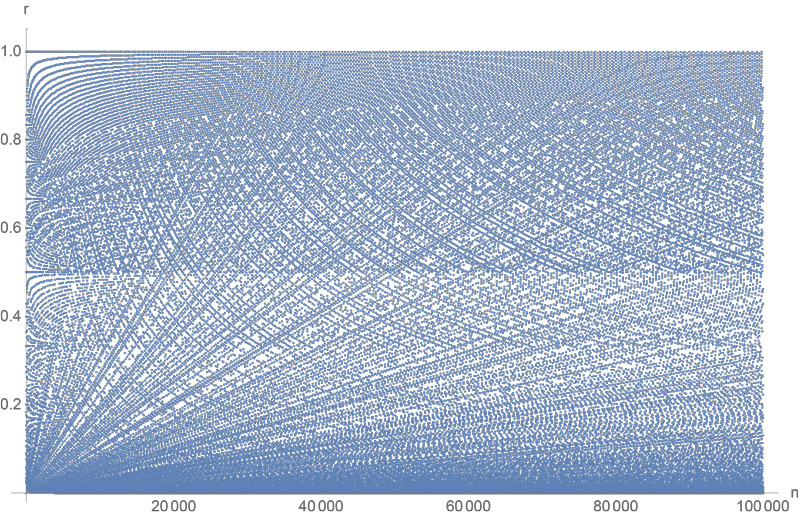
Fact2Ratio
This is a plot of what I call the squareness ratio $r(n)$ of a natural number $n$ (or simply the "squareness"). The squareness $r(n)$ is the largest ratio $\le 1$ that can be obtained by partitioning the factors of $n$ into two parts and forming the ratio of their products. A perfect square has squareness $1$. A prime $p$ has squareness $1/p$. In a sense, the squareness measures how close is $n$ to a perfect square.

The squareness ratios for the first ten number $n=1,\ldots,10$ are $$1,\frac{1}{2},\frac{1}{3} ,1,\frac{1}{5},\frac{2}{3},\frac{1}{7},\frac{1}{2},1,\frac {2}{5} \;.$$ A more substantive example is $n=12600=2 \cdot 2 \cdot 2 \cdot 3 \cdot 3 \cdot 5 \cdot 5 \cdot 7$, for which the largest ratio is $$\frac{3 \cdot 5 \cdot 7}{2^3 \cdot 3 \cdot 5}=\frac{7}{8}=0.875 \;.$$ One more example: $n = 2^2 \cdot 3^2 \cdot 5^2 \cdot 7 \cdot 11 = 69300$, $$r(n) = \frac{2^2 \cdot 3^2 \cdot 7}{5^2 \cdot 11}=\frac{252}{275} \approx 0.92 \;.$$

The only feature of this plot—the rays through the origin—that is evident to me is explained by the fact that, for a prime $p$, for $n = k p$ and $k=1,\ldots,p$, the squareness ratio is $k/p$, and so those ratios lie on a line through the origin of slope $\frac{1}{p^2}$. MSE user PattuX emphasized that similar rays occur for particular composite $n$.

Several other features could use explanation:

(1) The discernable density change at $r=\frac{1}{2}$.

(2) The (apparent) hyperbolas.

(3) The interesting structure near $r=1$, both negative (hole-)curves and positive (dot-)curves:


SqDetail
Detail: $35 K \le n \le 60K$ (approximately), near $r=1$.
I welcome explanations for (1), (2), (3), and other apparent features of the plot. This is to satisfy curiosity; it is far from my expertise.


Added(1): As per Gerhard Paseman's request, the plot with only odd $n$ ratios:
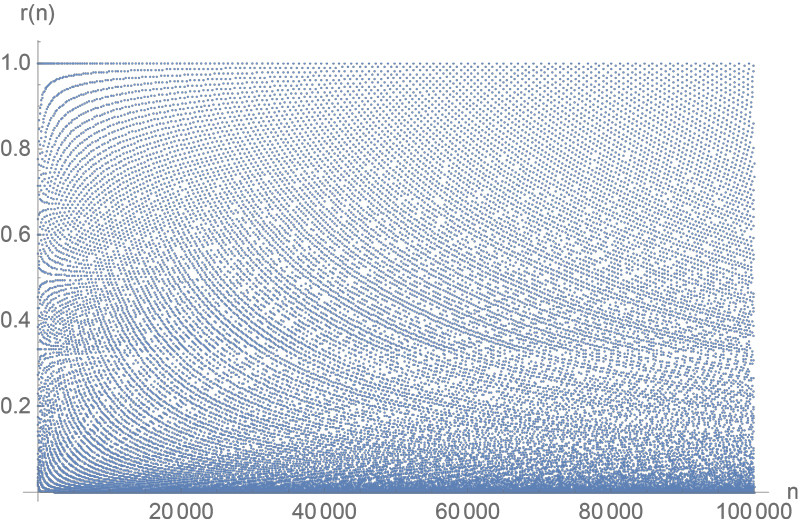
OddOnly
        Squareness ratio $r(n)$ for odd $n$ only; even $n$ not plotted.


Added(2): The landscape is rather different for larger $n$ (in accordance with Lucia's insights):


Sq900K
        Squareness ratio $r(n)$ for $900{,}000 \le n \le 1{,}000{,}000$.


$\endgroup$
7
  • 2
    $\begingroup$ I think it is clearer to say that $r=d^2/n$ for $d$ the largest divisor of $n$ with $d^2 \leq n$, assuming I interpret your statement correctly. Just seeing d^2 makes me think of conic sections; this algebraic reformulation might help answer some of your questions. Gerhard "Except For The Density Change" Paseman, 2016.11.20. $\endgroup$ Commented Nov 21, 2016 at 0:55
  • 2
    $\begingroup$ What happens if you make the same plot but leaving out all of the even numbers? Maybe that will affect or explain the density you see in the current plot. Gerhard "Is Wanting More Pretty Pictures" Paseman, 2016.11.20. $\endgroup$ Commented Nov 21, 2016 at 1:09
  • 2
    $\begingroup$ @GerhardPaseman I couldn't resist. James "wondering why Gerhard Paseman always does this" Nixon, 2016.11.20 $\endgroup$
    – user78249
    Commented Nov 21, 2016 at 1:16
  • 1
    $\begingroup$ I'm curious about the densities here. For fixed $x \in (0,1)$, define $D(x)$ to be the set of integers with ratio at most $x$. Then could you show us a plot of $f(x,N) = | D(x) \cap [N] | / |N|$? Ideally a few plots. Some showing this as a function of $x$ and $N$ very large. And some showing this as a function of $N$ with $x$ fixed. Pat "also wondering about the middle names" Devlin $\endgroup$
    – Pat Devlin
    Commented Nov 21, 2016 at 1:23
  • 6
    $\begingroup$ It looks like when you only plot the values for odd $n$ the line at 1/2 goes away, but there's a faint line at 1/3. I bet if you plotted the numbers not divisible by 2 or 3, there would be only a faint line at 1/5. $\endgroup$
    – Pat Devlin
    Commented Nov 21, 2016 at 1:31

4 Answers 4

14
$\begingroup$

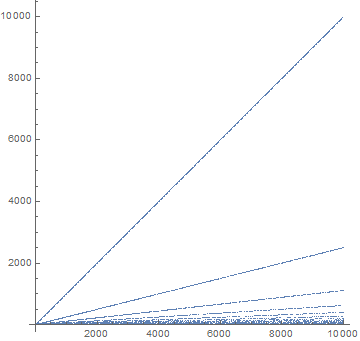
At least some part of the features may be explained by plotting $\frac1{r(n)}$, it looks like this:

enter image description here

It is more or less clear that the slopes are $\frac1{k^2}$, $k=1,2,3,...$

(So the original plot is a superimposition of the corresponding hyperbolas)

$\endgroup$
5
  • 1
    $\begingroup$ Beautiful! ${}$ $\endgroup$ Commented Nov 21, 2016 at 21:58
  • $\begingroup$ Isn't this simply picking out the families $p$, $4p$, $9p$ etc as one ranges over primes $p$? $\endgroup$
    – Lucia
    Commented Nov 22, 2016 at 0:37
  • $\begingroup$ @Lucia Also $d^2p_1\cdots p_k$ for all square free $p_1\cdots p_k$. $\endgroup$ Commented Nov 22, 2016 at 5:54
  • 1
    $\begingroup$ That's all numbers, and I don't think you're picking them out in these lines with slope $1/d^2$. $\endgroup$
    – Lucia
    Commented Nov 22, 2016 at 5:57
  • $\begingroup$ Hmmm right... it may happen e. g. that $(dp_j)^2\le d^2p_1\cdots p_k$, then the number is not on the $d$th line $\endgroup$ Commented Nov 22, 2016 at 6:01
22
$\begingroup$

You're asking about the distribution of $d^2/n$ where $d$ is the largest divisor of $n$ below $\sqrt{n}$. This is closely related to work on the multiplication table problem, from which it follows that the square-ness ratio is usually close to 0. So the observed patterns are eventually insignificant (at least to first order, they may be significant in lower order terms) and eventually the plot will just be really concentrated at the bottom.

To expand a bit, Kevin Ford has shown (following earlier work of Erdos and Tenenbaum) that the number of integers up to size $x$ with a divisor in $y$ to $2y$ is $$ H(x;y, 2y) \asymp \frac{x}{(\log y)^{\delta} (\log \log y)^{3/2}} $$ with $$ \delta = 1 -\frac{1+\log \log 2}{\log 2} = 0.08607\ldots . $$ Using this with $y= \sqrt{x}/2$, $\sqrt{x}/4$, $\ldots$, $\sqrt{x}/2^k$, we see that only $\ll k x /((\log x)^{\delta}(\log \log x)^{3/2})$ integers below $x$ have a divisor in $(\sqrt{x}/2^k, \sqrt{x})$. Taking $k= 2\log \log x$ (for example), it follows readily that $\ll x/(\log x)^{\delta}$ numbers below $x$ have a square-ness ratio larger than $1/\log x$.

$\endgroup$
13
$\begingroup$

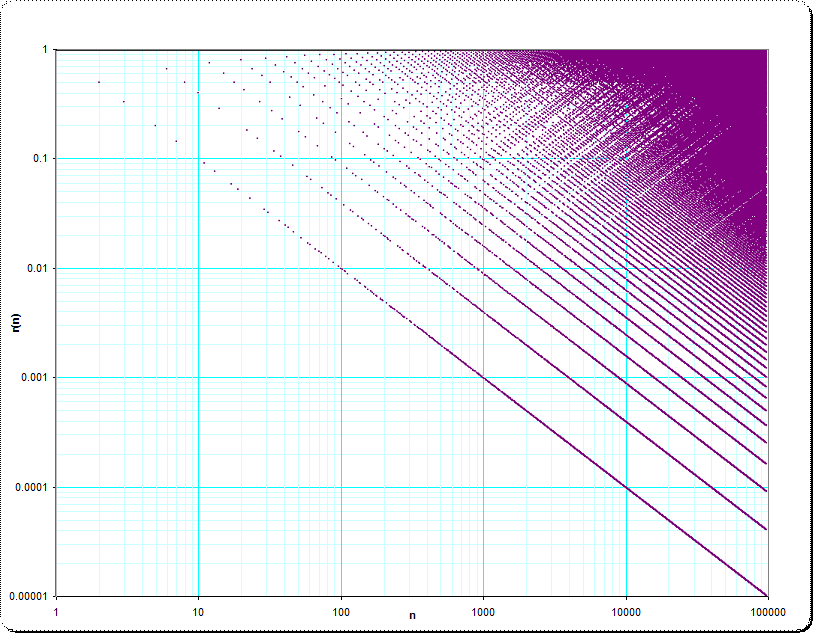
Just an additional comment: because it was discussed, whether the structures shall be visible when n increases, I've thought, it would possibly be interesting to rescale the axes. One additional plot, the original values recomputed, but $n$- and $r(n$)-axes logarithmically scaled for display gives this image:

squarednumbers, axes logarithmically scaled

$\qquad \qquad $ ($ \small n \to \log_{10}(n) $ , $ \small r(n) \to \log_{10}(r(n)) $ where $ \small n=1 \ldots 100 000$, $ \small 0 \lt r(n) \le 1$)

$\endgroup$
2
  • 2
    $\begingroup$ Wow! Could you clarify the range of the axes and exactly what you are plotting? Thanks! $\endgroup$ Commented Nov 21, 2016 at 17:56
  • 1
    $\begingroup$ @JosephO'Rourke - done; inserted into the answer. $\endgroup$ Commented Nov 21, 2016 at 19:08
4
$\begingroup$

It is true that in the long run most points are near the bottom but there are the observed patterns in the portion shown. Here are some comments in a slightly stream of consciousness order:

At the top left the increasing curve right below the line $y=1$ must be $(k(k-1),1-1/k)$ which is certain points pretty close to $y=1-1/\sqrt{x}.$ In the plot it appears piecewise constant but that is an artifact of the plotting.

Below there we see the similar curves $(k(k-c),1-c/k).$ In the long run these become indistinguishable from $y=1$

To be sure, plot the point using something like Maple which lets you probe for coordinates. Some work of this type could explain other features.

To my eye the top line for the (approximately) $35K \le n \le 60K$ plot seems to have $97$ points. There should be about $57$ squares $(k^2,1)$ in that range so I guess the $n=k(k-1)$ are indistinguishable but the $n=k(k-2)$ are visually lower.

Coming down and back from each point $(k^2,1)$ we have a curve $(k^2-j^2,\frac{k-j}{k+j})$ This is especially clear in the plot ending at $n=10^6.$ each of these break eventually when the numerator and denominator have many small factors. For example I think the sequence going down from (104^2,1) has $y$ values $103/105,102/106,\cdots,89/119$ however the next point in that sequence $(88\cdot 120,\frac{88}{120})$ can get lifted up to replace $\frac{88}{120}$ with $\frac{96}{110}.$ I feel that more could be said about how long it takes before the sequence can break the first time than I have figured out. After such a break the pattern might pick up again as in $\frac{87}{121}$ next is $\frac{86}{122},\frac{85}{123},\cdots$

These curves, which do go on for a while are approximately parallel and interspersed are the curves $((k+j+1)(k-j),\frac{k-j}{k+j+1}.$ These are all the points "really near" $y=1$ (a bold statement that needs justification.) In between , then, are white curves. I count $100$ of these curves in the plot which runs from $949^2$ to $1000^2$ which is what one would expect.

For $n=2k^2$ we can get the point $(n,\frac12).$ It may be possible to have a higher point. In a dramatic case $(2\cdot 35^2,\frac{49}{50}).$ However for over $60$ values $k \le 100$ we do get $(2k^2,\frac{1}{2}).$ I didn't examine larger $k.$

For any point $(x,y)$ we have potential points $(cx,\frac{1}{cy})$ for small $c.$ It might be possible to have a higher $y$ but if one runs over a curve then a good fraction of the points might transform that way creating a transformed curve. I imagine the curves going up from $y=1/2$ for $900K \le n \le 1000K$ are (partial) transforms of the lines coming down from $y=1$ for $450K \le n \le 500K.$ These seem to have an almost reflection below $y=1/2$ making sideways parabolas. I don't have an explanation but suspect getting the actual coordinates would reveal much.

Similarly for any point $(x,y)$ we have potential points $(xz^2,y).$ Again, it might be possible to improve on this in some cases but that would be more challenging for $y$ closer to $1.$ Likewise if $z$ has large divisors relative to $x.$

I'll stop with the generalization that if we have $(x_1,y_1)$ and $(x_2,y_2)$ then we have the potential points $(x_1x_2,\frac{y_1}{y_2}).$ Running over two curves , both with large $y$ values we can get parametric families such as $$\left((k^2-u^2)((k+1)^2-v^2),\frac{(k\pm u)(k+1\pm v)}{(k\mp u)(k+1\mp v)}\right).$$ I can imagine that clusters of points would result, perhaps with explainable holes.

Holding, say $(x_1,y_1)$ constant might give transforms of curves. It would be easy to probe this with some plots. For example the curve above $(104^2-j^2,\frac{104-j}{104+j})$ combined with the point $(56,7/8)$ gives $y=\frac{7(104+j))}{8(104-j})$ for $j=1\cdots 6$ getting to $\frac{770}{784}$ but then switches to $y=\frac{8(104-j))}{7(104+j})$ starting with $776/777.$ Again, some of those points might be possible to improve.

$\endgroup$
1
  • 1
    $\begingroup$ A nuanced, detailed micro-analysis. The explanation near $y=1$ is especially insightful. Thanks! $\endgroup$ Commented Nov 22, 2016 at 11:57

You must log in to answer this question.

Not the answer you're looking for? Browse other questions tagged .