35
$\begingroup$

One way to phrase the "concentration-of-measure" phenomenon is that, for a Euclidean sphere $S^d$ in $d$ dimensions, for large $d$, "most of the mass is close to the equator, for any equator."1

Q. How could one explain/justify this intuitively—perhaps just verbally—to a mathematically literate but naive audience (say, advanced undergraduate math majors)?

That "most of the mass is close to the equator, for any equator" seems almost contradictory (imagining orthogonal equatorial hyperplanes), or at the least, superficially quite puzzling. Can one only gain intuition via working through details of the Brunn–Minkowski theorem or the isoperimetric inequality?


1Boáz Klartag, in a book review in the AMS Bulletin, July 2015, p.540. According to the Wikipedia article, the idea goes back to Paul Lévy.

$\endgroup$
2
  • 1
    $\begingroup$ Dimension higher than $3$ is perplexing, that's true. Especially dimension $d \to \infty$ as in this case... $\endgroup$ Commented Jun 27, 2015 at 19:39
  • $\begingroup$ Thanks for the thoughtful answers! Andreas Blass's zones is my favorite, but the voters have spoken in favor of Henry Cohn's random-vector viewpoint. $\endgroup$ Commented Jun 28, 2015 at 14:22

6 Answers 6

61
$\begingroup$

As I see it, the key intuition is passing from the equator orthogonal to a single vector to looking at a whole orthonormal basis.

Suppose we pick a random unit vector $(x_1,\dots,x_n)$. What we want to know is why $x_1$ is probably near zero, since this is equivalent to being near the equator relative to the first basis vector. But this feels intuitively obvious to me: all the coordinates have the same distribution, and they surely can't all be large, so they had better all be small.

To be a little more precise, we have $x_1^2+\dots+x_n^2=1$, and each coordinate has the same distribution, so the expected value of $x_1^2$ is $1/n$. Now we can just apply Markov's inequality. For example, the probability that $|x_1|$ is at least $1/n^{1/4}$ must be at most $1/n^{1/2}$, since otherwise the expected value of $x_1^2$ would be too large.

(This is not so different from Bjørn and Dustin's answers, but expressed in a less sophisticated way.)

$\endgroup$
3
  • 4
    $\begingroup$ Interesting. So maybe one insight that dispels some of the paradoxical nature is that "being near the equator" means that $x_i$ is small---as opposed to a mistaken intuition that other components are large. $\endgroup$ Commented Jun 27, 2015 at 23:11
  • 4
    $\begingroup$ That's a good way of putting it. Making one component small forces the others to be large in aggregate, but when there are many of them this is still compatible with each one being small individually. $\endgroup$
    – Henry Cohn
    Commented Jun 27, 2015 at 23:25
  • 3
    $\begingroup$ +1 "all the coordinates have the same distribution, and they surely can't all be large, so they had better all be small" $\endgroup$
    – R Hahn
    Commented Jun 28, 2015 at 7:00
29
$\begingroup$

Visualize first, for comparison, the 2-dimensional unit sphere in 3-dimensional Euclidean space (something that I can visualize!), and imagine it cut, by circles of latitude (perpendicular to the $z$-axis), into narrow zones. Of course, the zones closer to the poles have smaller radii, and therefore smaller circumferences, than the zones near the equator. It's well-known that this decrease of circumference, as you approach the poles, exactly compensates for the increasing "tilt" of the zones, so that a zone's area is proportional to its height as measured in the $z$-direction.

Now let's "look" at $d$-dimensional unit sphere in $(d+1)$-dimensional Euclidean space. Cut it into zones similarly, at the same $z$-coordinates as before. What has changed? The radii of the zones and their tilt are the same as in the 2-dimensional case, but the "circumferences" have become $(d-1)$-dimensional volumes. Now the $(d-1)$-dimensional volume of a sphere depends on the radius $r$ much more violently than $1$-dimensional circumferences. $r^{d-1}$ is almost exactly zero while $r$ is substantially $<1$; it becomes respectable only when $r$ is almost up to $1$. So the zones near the poles are way smaller, compared to equatorial zones, in the high-dimensional case than in the $2$-dimensional case.

$\endgroup$
3
  • 1
    $\begingroup$ It's debatable whether my answer here is really different from the one posted by @foliations while I was writing mine, or whether it's more intuitive than a standard proof. But it uses fewer mathematical symbols and so has a chance of being verbally explainable. $\endgroup$ Commented Jun 27, 2015 at 20:18
  • $\begingroup$ Very nice description in terms of zones! All that is needed to understand this is the behavior of $r^{d-1}$. Which, as @foliations says, is the key ($t^n$ in f's version). $\endgroup$ Commented Jun 27, 2015 at 22:59
  • $\begingroup$ This view nicely explains why the phenomenon is definitely not present in $\mathbb{R}^3$. $\endgroup$ Commented Jun 28, 2015 at 0:58
18
$\begingroup$

Take iid Gaussian random variables $X_1,\ldots,X_d$ with mean $0$ and variance $1/d$. Normalizing the vector $X=(X_1,\ldots,X_d)$ will produce a random point on the unit sphere, but it's already close to having unit norm, so we will avoid this for the sake of intuition. For each unit vector $v$, there is an equator given by

$$\{x\in S^{d-1}:\langle x,v\rangle=0\}$$

Observe that $\langle X,v\rangle$ is Gaussian with mean $0$ and variance $1/d$. Thus, $X$ is typically close to $v$'s equator when $d$ is large. This is because it only has a unit of energy to spread across $d$ dimensions, so the amount of energy in each dimension must vanish.

$\endgroup$
1
  • 2
    $\begingroup$ "it only has a unit of energy to spread across $d$ dimensions": Nice phrasing! $\endgroup$ Commented Jun 28, 2015 at 13:36
10
$\begingroup$

I'm not sure how conceptual this is, but I think the explanation is the same as the (intuitively obvious?) fact that most of the area underneath the graph of the function $t^n$ over the unit interval is near $t=1$. In the end it may just be this computational fact, but it is easy enough to see.

Just to flesh things out, consider $\mathbb{S}^n=\{x_1^2+\cdots+x_{n+1}^2=1\}$.

By the co-area formula (one can of course appeal to more elementary calculus in the computations below as well) we have that (for $0\leq h\leq 1$)

$$ Vol_n(\mathbb{S}^n\cap \{-h\leq x_1\leq h\})=\int_{-h}^h \int_{\{x_1=t\}\cap \mathbb{S}^n}\frac{1}{|\nabla_{\mathbb{S}^n} x_1|} d\mu \, dt. $$ Observe that $\nabla_{\mathbb{S}^n} x_1$ actually depends only on $t$ (and in particular is independent of $n$).
Indeed, $$ Vol_n(\mathbb{S}^n\cap \{-h\leq x_1\leq h\})=\int_{-h}^h \frac{1}{\sqrt{1-t^2}}Vol_{n-1}(\{x_1=t\}\cap \mathbb{S}^n) dt. $$ Hence, $$ Vol_n(\mathbb{S}^n\cap \{-h\leq x_1\leq h\})=Vol_{n-1}(\mathbb{S}^{n-1})\int_{-h}^h(1-t^2)^{(n-2)/2} dt. $$ Since $0\leq (1-t^2)<1$ when $t\neq 0$, for large $n$ the area under the graph is concentrated near $t=0$, i.e. the equator.

$\endgroup$
8
$\begingroup$

If $$x_1^2+\dots+x_{n+1}^2=1$$ then $$ x_1^2+\dots+x_n^2 = 1-x_{n+1}^2 \in [0,1]. $$ Now $S = \sum_{i=1}^n x_i^2$ for $-1\le x_i\le 1$ has expectation $c\cdot n$ for a certain $c>0$, and will be approximately normally distributed. For large $n$, $c\cdot n>1$, so the most likely value of $S$ in $[0,1]$ is 1, corresponding to $x_{n+1}=0$. This much is trivial.

But moreover, crucially, the normal distribution has rapidly decaying tails (looking like $e^{-x^2/2}$), hence most of the points in $\mathbb S^n$ will have $x_{n+1}\approx 0$.

$\endgroup$
5
$\begingroup$

This answer is complementary to the other answers. I'll attempt to tackle the paradox

That "most of the mass is close to the equator, for any equator" seems almost contradictory (imagining orthogonal equatorial hyperplanes)...

head-on by leveraging some intuition about the 3-sphere.

Where the intuition struggles is in seeing how two $\epsilon$-width equatorial bands oriented in orthogonal directions can have any sort of substantial overlap, much less cover most of the sphere. And they must have substantial overlap: if an equatorial band covers 99% of the area of the sphere, and an orthogonal equatorial band also covers 99% of the sphere, then the overlap of the two bands has to cover at least 98% of the sphere.

The issue is that for the two spheres that are easy to visualize, the 1-sphere and the 2-sphere, the overlap of narrow equatorial bands in orthogonal directions is indeed insubstantial. For the 1-sphere it is, in fact, empty: one equatorial band consists of arcs on the west and east sides of the circe; the other consists of arcs on the south and north sides.
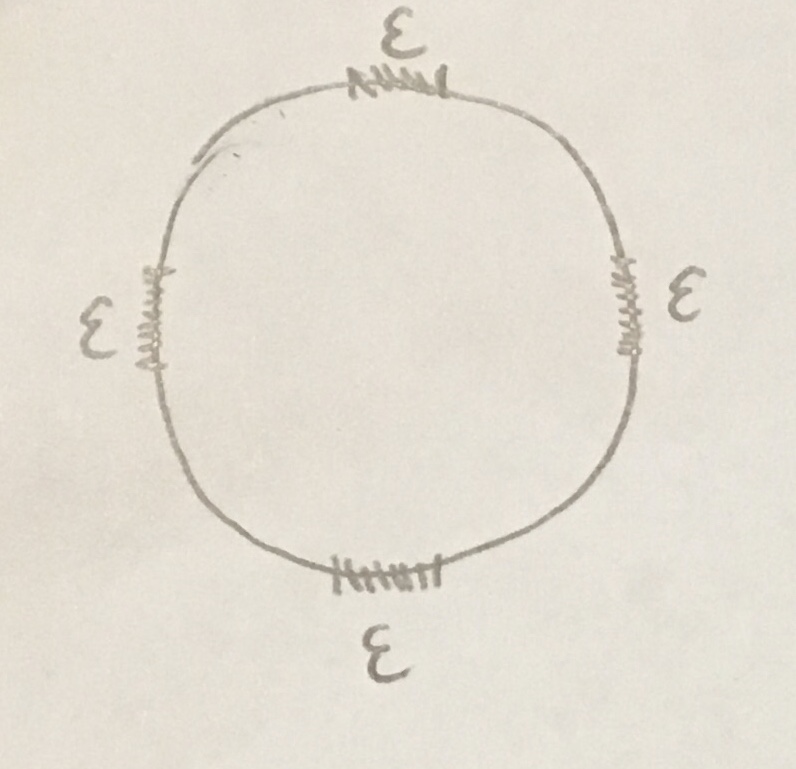
Of course if we increased $\epsilon$ so that each band covered 99% of the area (circumference in this case), then there would be an overlap, of four disconnected arcs, but as a schematic for the situation in higher dimensions this fails since the arcs disappear as $\epsilon$ shrinks.

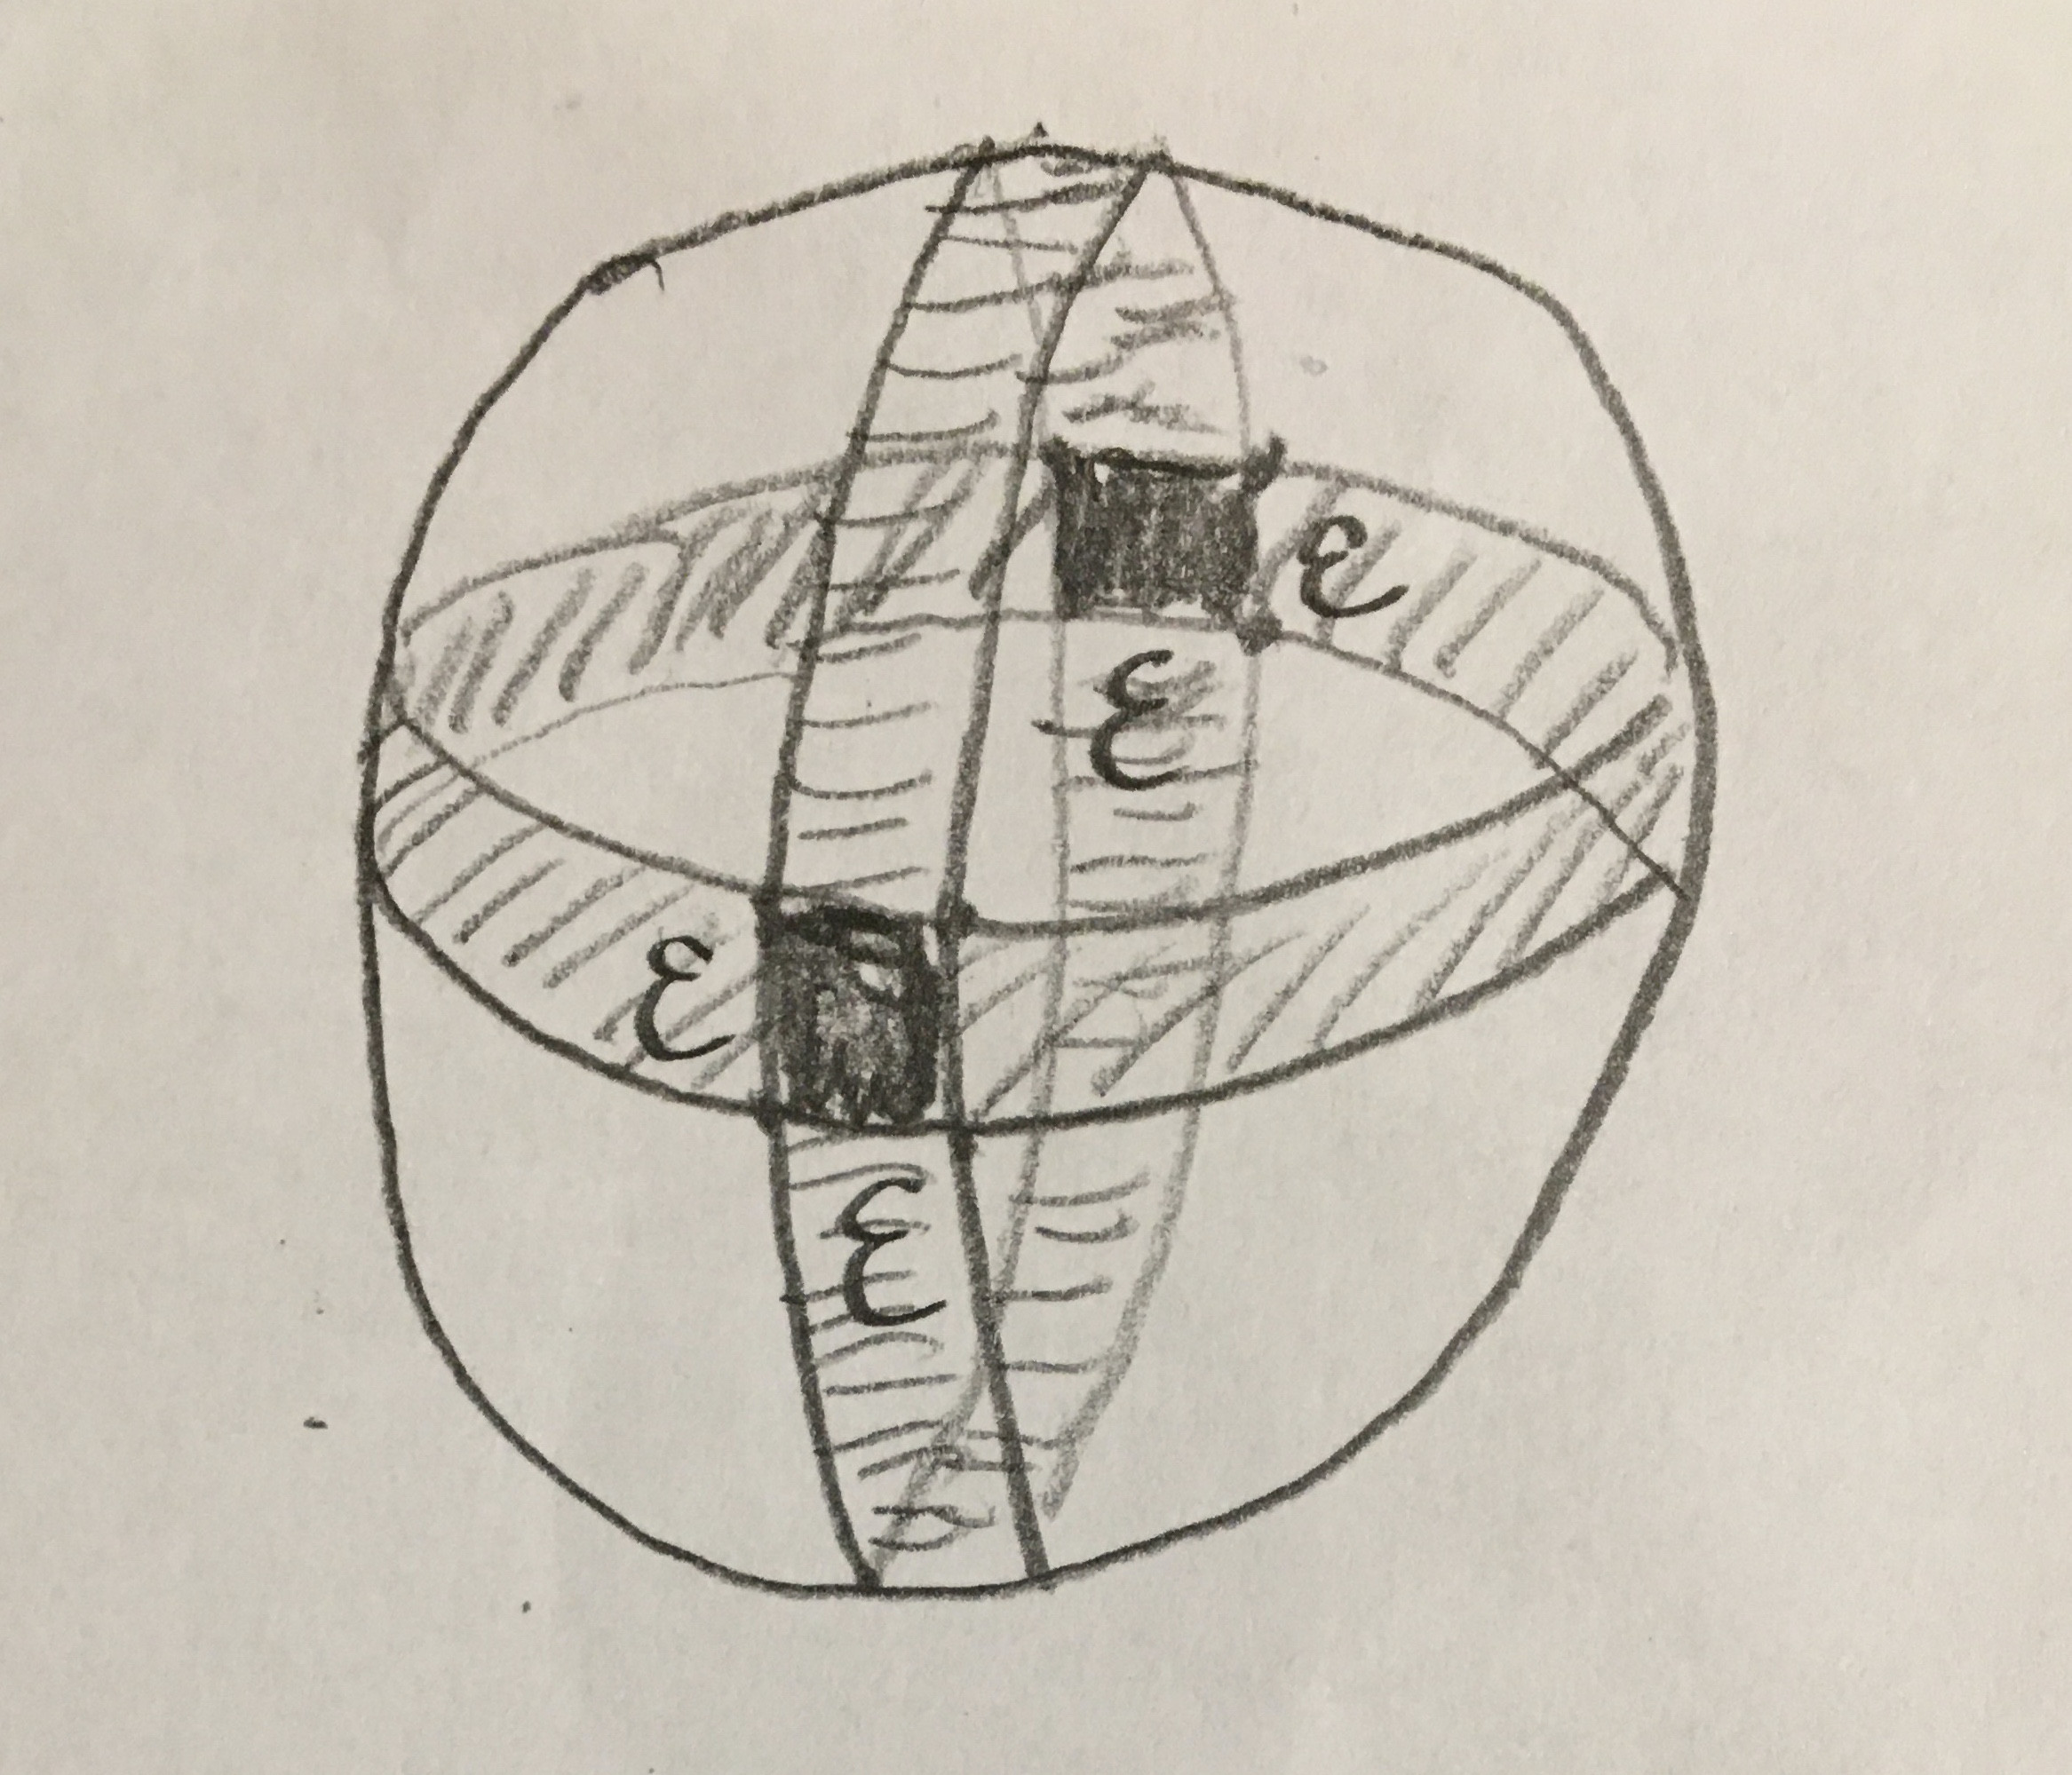
The situation is hardly better for the 2-sphere. The overlap is non-empty this time, but it consists of two antipodal $\epsilon\times\epsilon$ patches (black regions) where the orthogonal belts overlap, and it is hard to imagine, even schematically, how the area of the patches can remain large as $\epsilon$ shrinks.
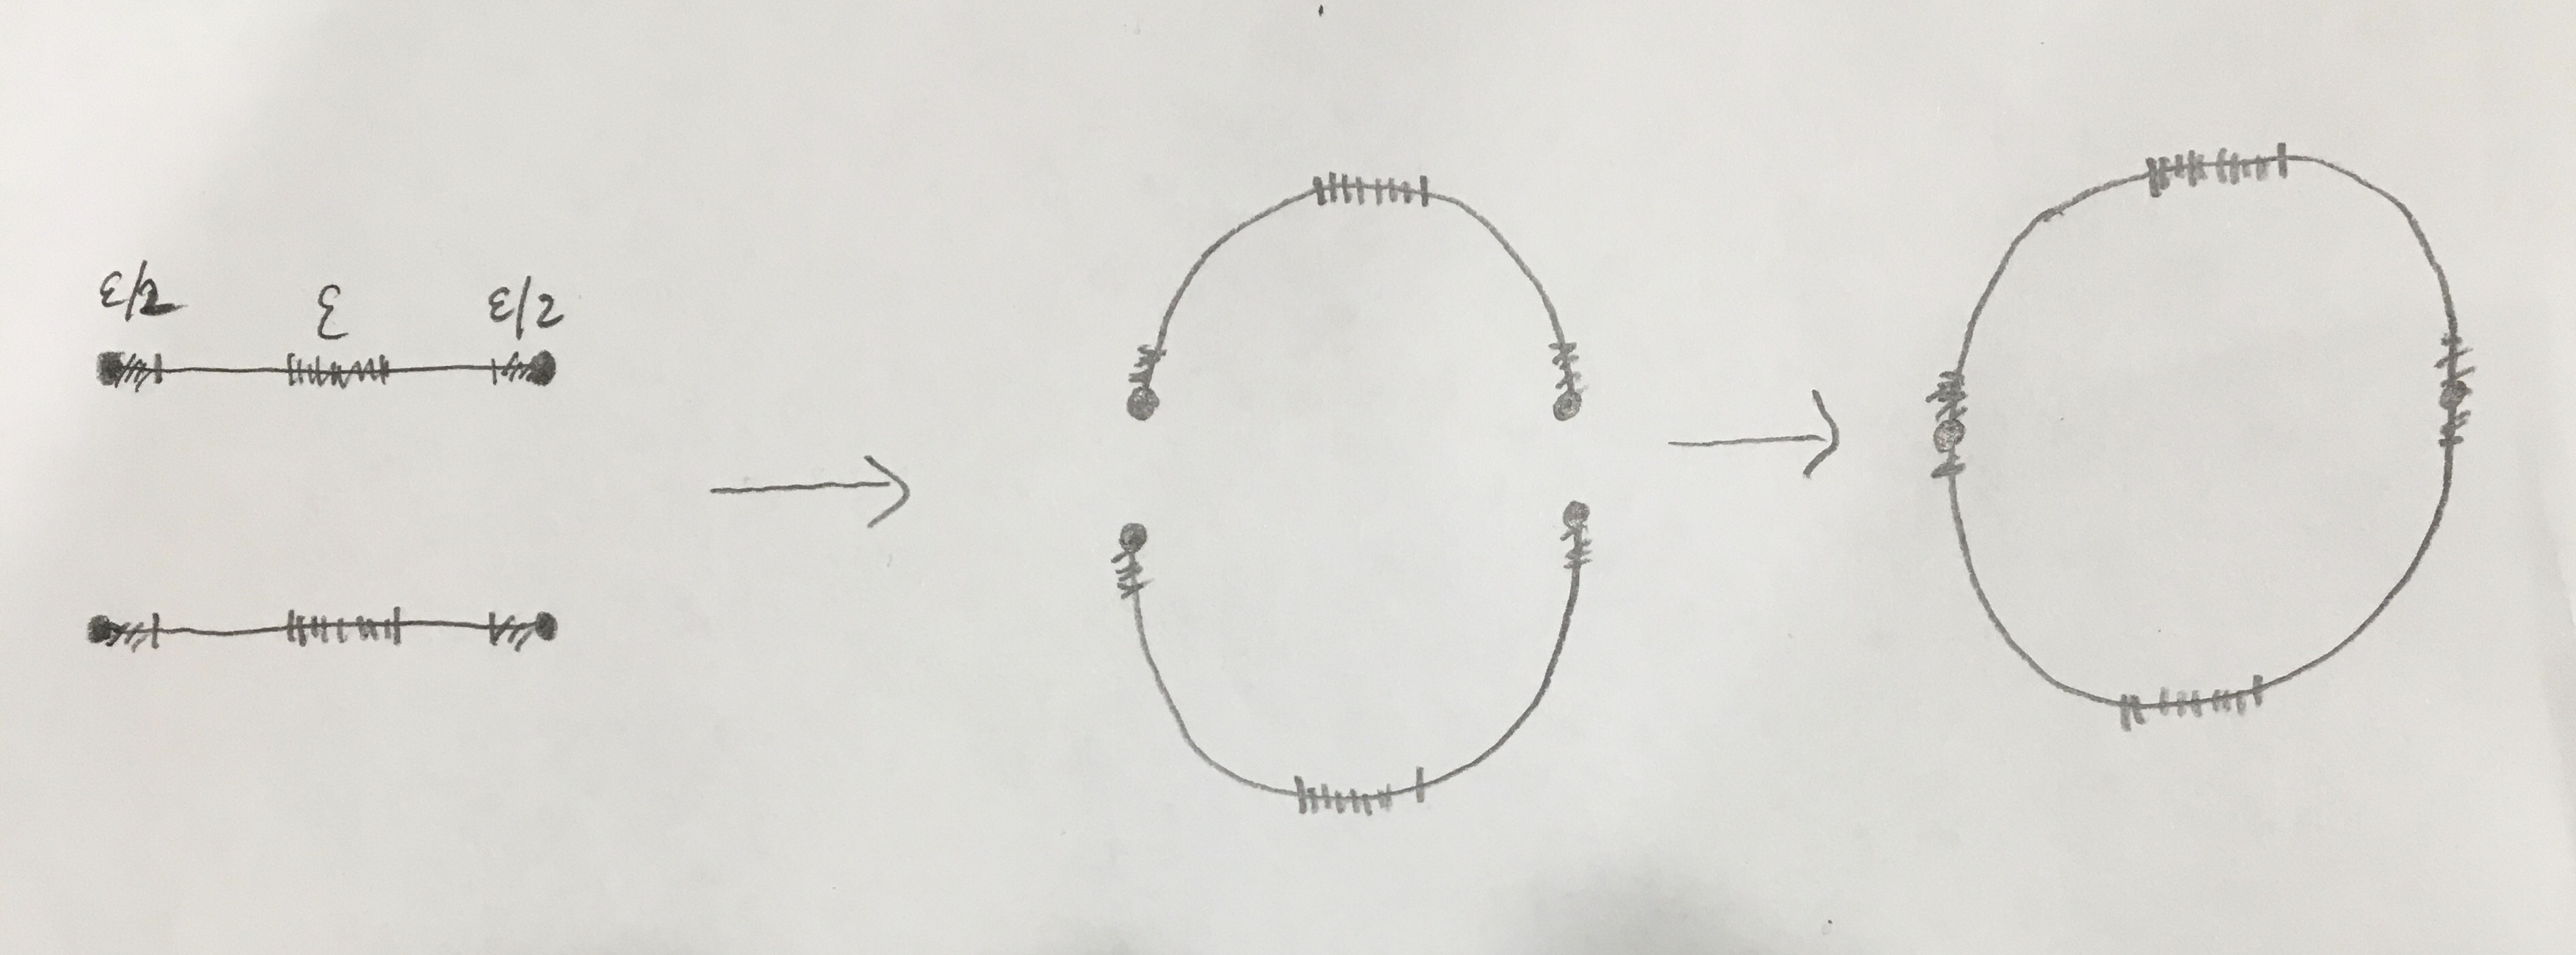
So how do things look for the 3-sphere? A picture of the 3-sphere is obtained by gluing together two 3-dimensional balls along their 2-dimensional surface. Let's redo the 1-sphere and 2-sphere by the analogous constructions. The 1-sphere is obtained by gluing together two 1-dimensional balls (line segments) along their 0-dimensional surfaces (endpoints). The west-east band originates with $\epsilon/2$-width segments at the surface (endpoints) of each line segment; the south-north band originates with an $\epsilon$-width segment spanning the equator (midpoint) of the line segments:
The 2-sphere is obtained by gluing together two 2-dimensional balls (disks) along their 1-dimensional surfaces (circles). One band originates with the $\epsilon/2$-width surface region (annulus) of each disk; the other originates with an $\epsilon$-width equatorial band of each disk:
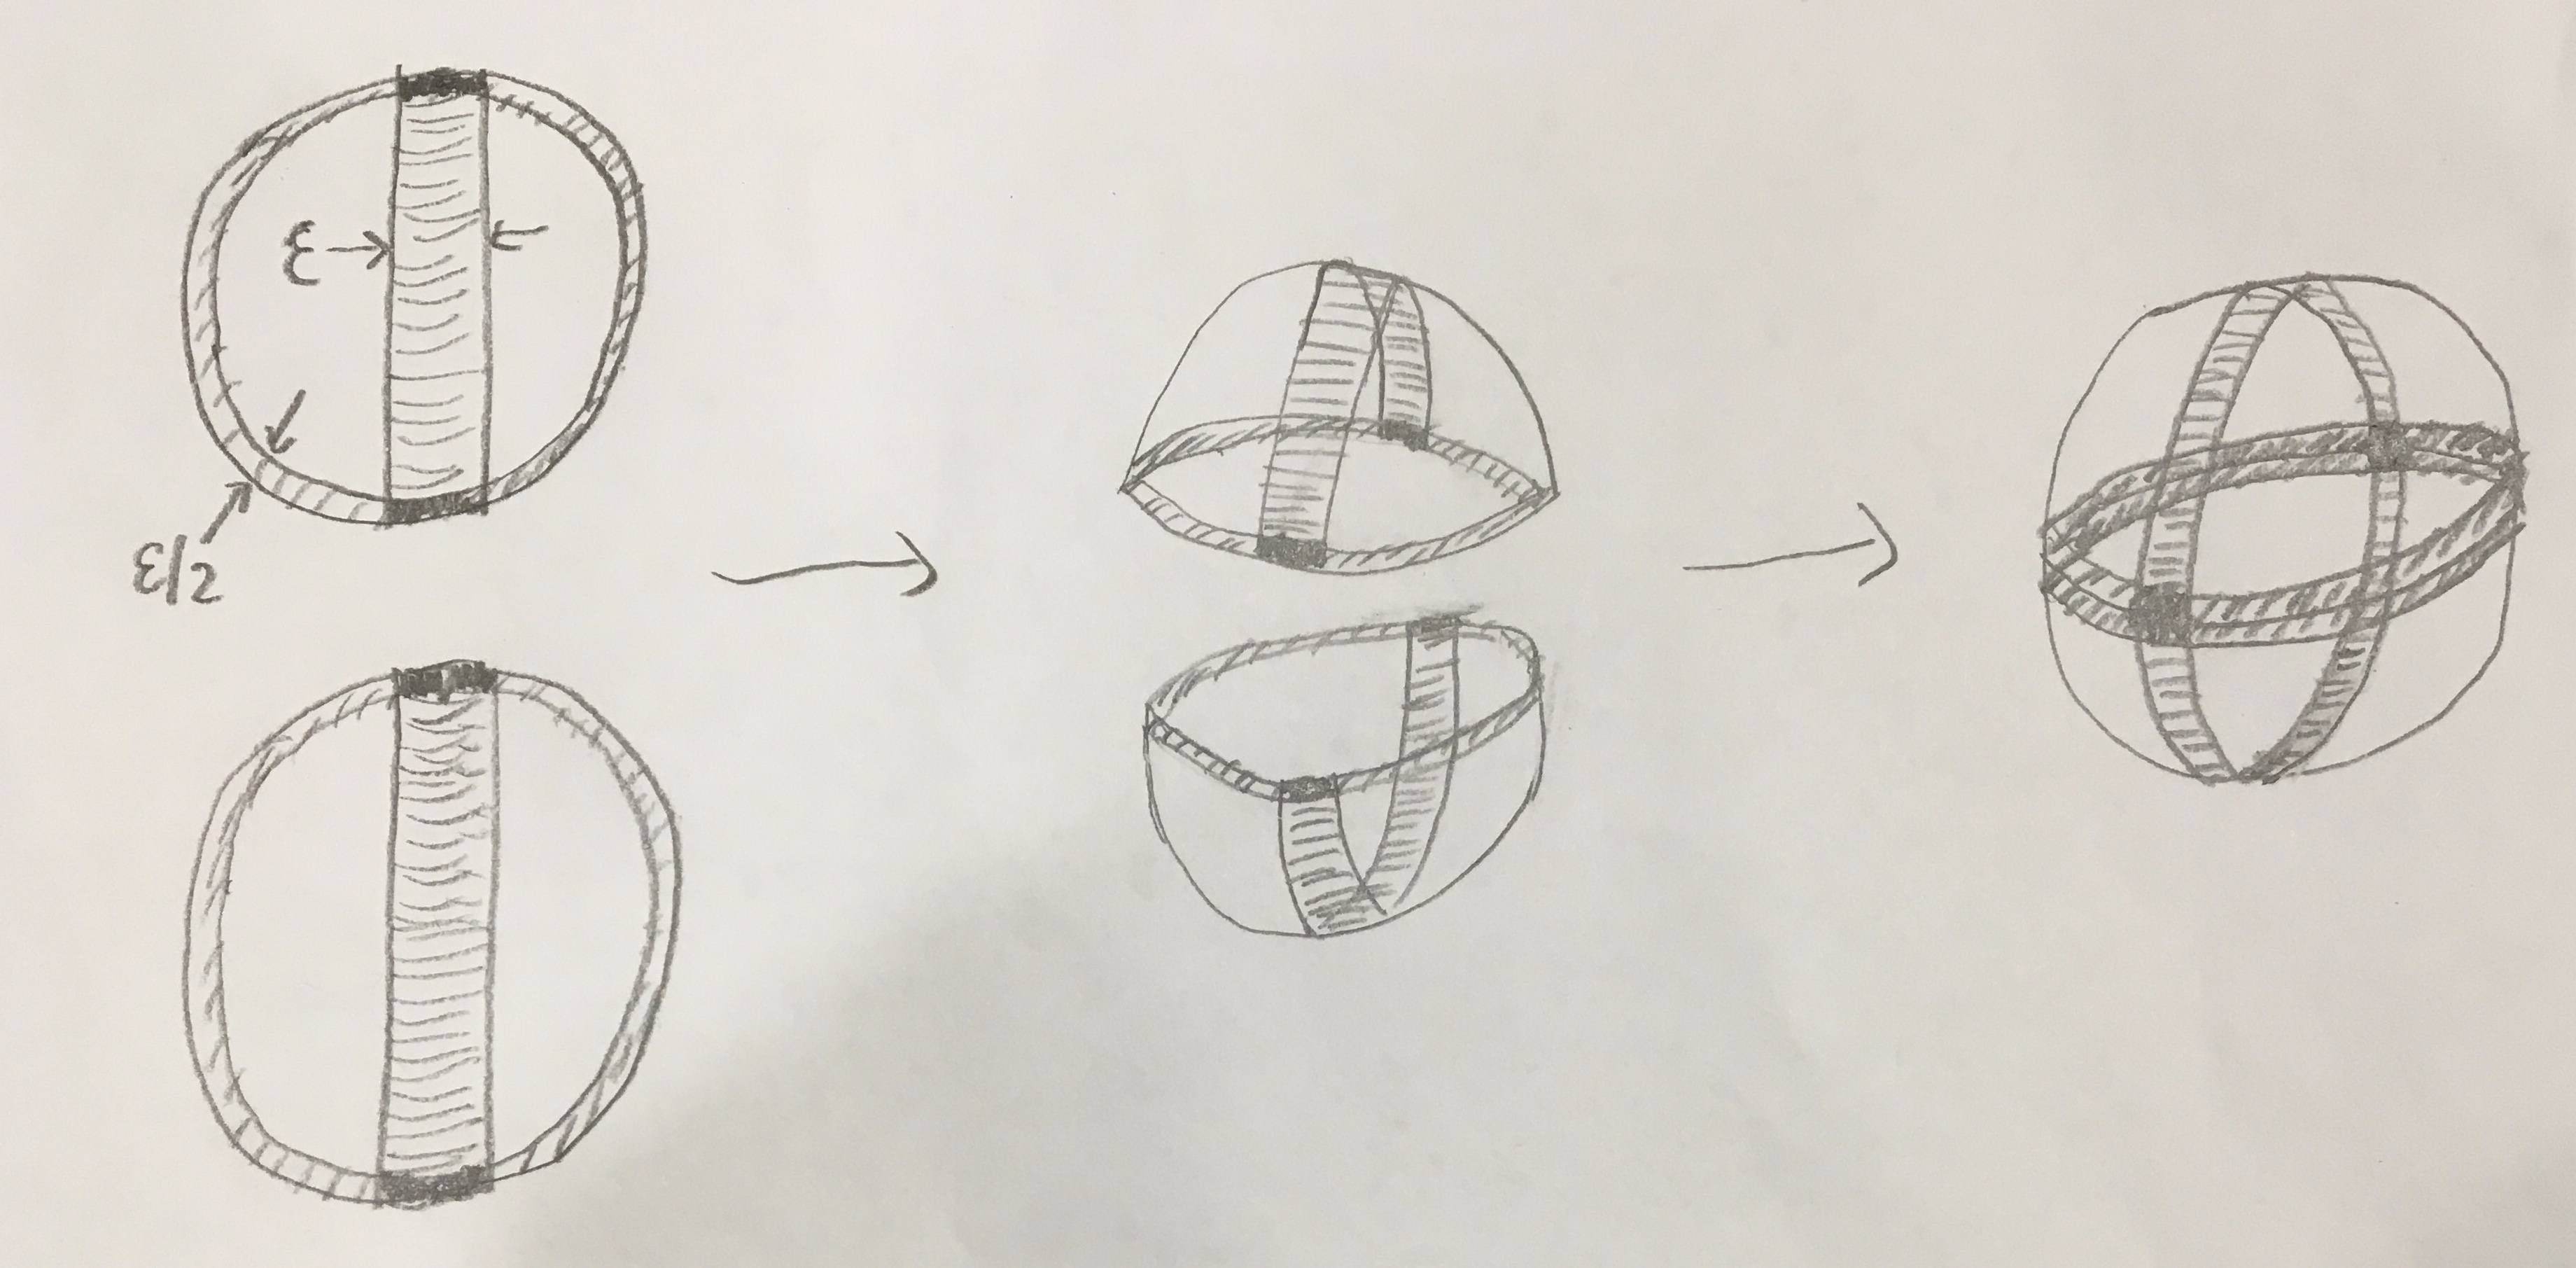
The 3-sphere is obtained by gluing together two 3-dimensional balls along their spherical surface. One "equatorial band" will be the result of gluing the two spherical shells of thickness $\epsilon/2$ along their outer surfaces to form a spherical shell of thickness $\epsilon$. The other will be the result of gluing two thickened disks of thickness $\epsilon$ along their circumference to form a second spherical shell of thickness $\epsilon$. (One of the thickened disks is shown in the diagram with its center at $\infty$.) The two spherical shells intersect in a band of width $\epsilon$, thickness $\epsilon$, and circumference $2\pi R$, where $R$ is the radius of the balls. (The intersection is what looks like the rim of a bicycle wheel near the center of the last figure.)
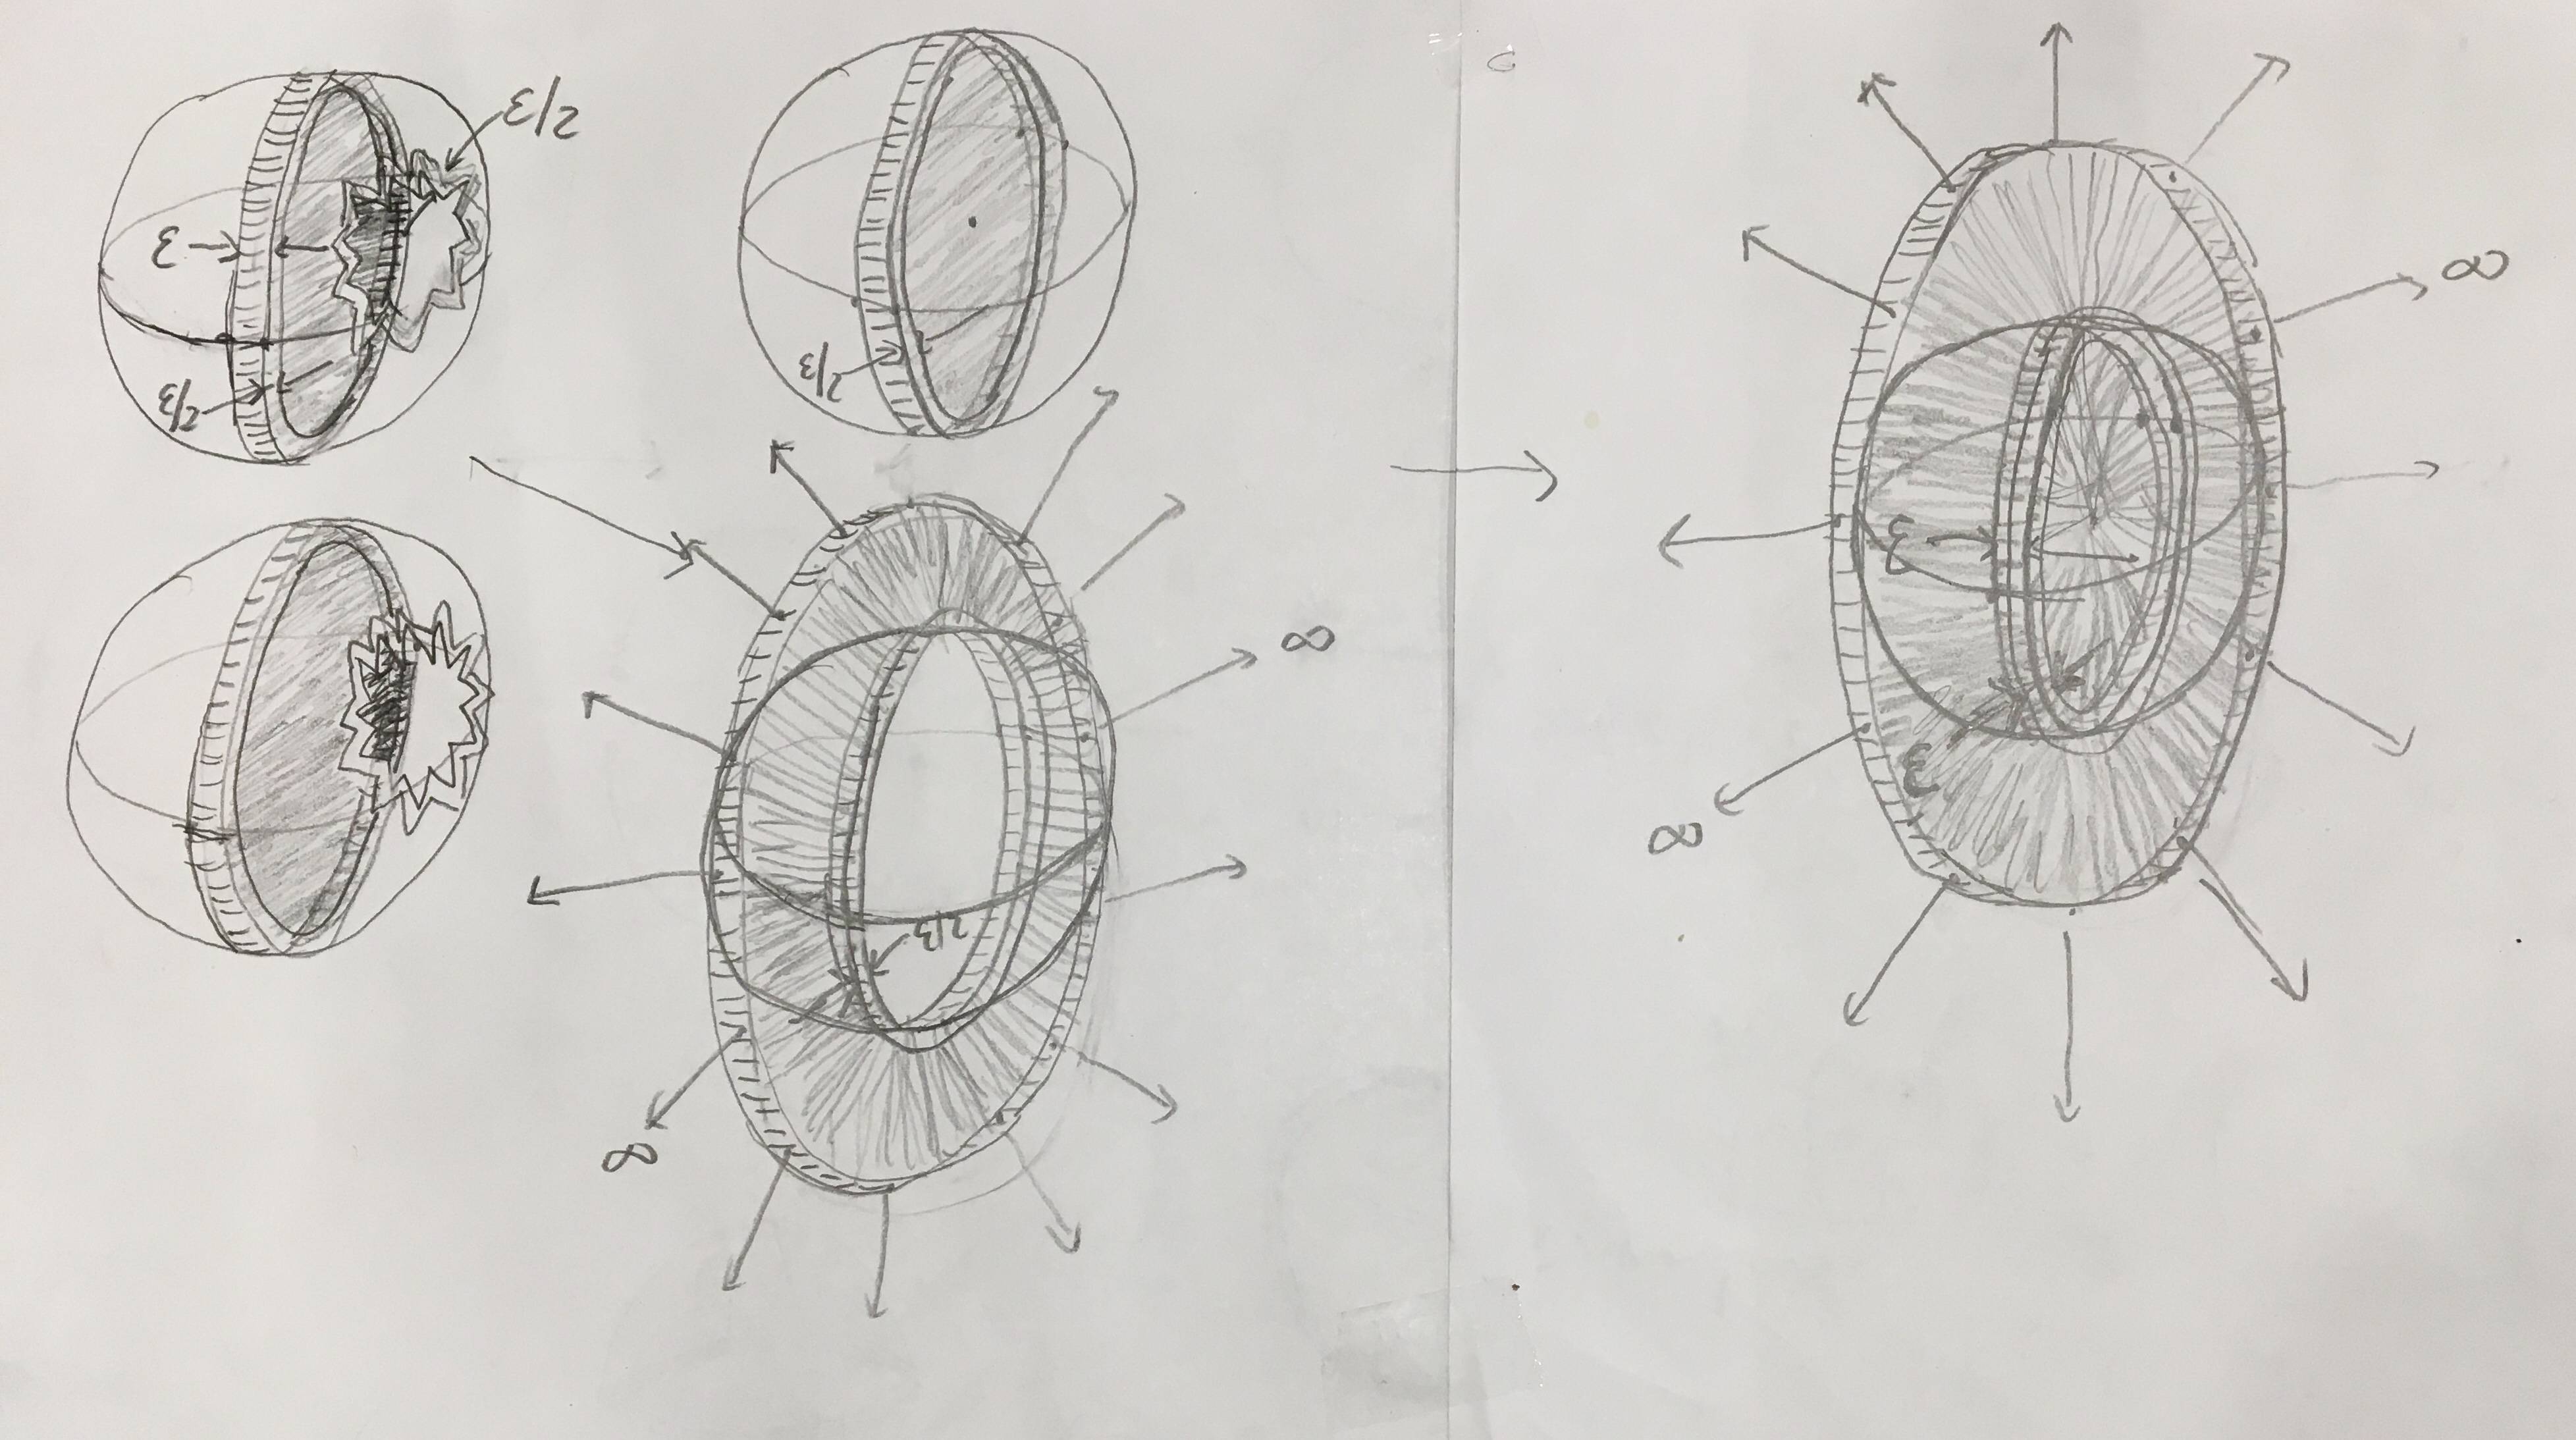
As a schematic for the $n$-sphere, with $n$ large, this picture seems to me successful. As $\epsilon$ shrinks, the overlap remains global in scope, containing a circumference. Furthermore, the picture starts to satisfy some consistency checks: It is easy to believe that most of the volume of an $n$-dimensional ball lies in its outer layer. It's somewhat less obvious but still plausible that most of the volume of an $n$-dimensional ball lies in a thickened disk containing the equator. (Andreas Blass's answer may help convince you of this). For both to be true, most of the volume must lie in a thickened surface band around the equator. That this is so is again plausible: if $n$ is large, then $n-1$ is also large, so most of the volume of the disk lies near its outer edge rather than near its center, that is, in the part where it overlaps the spherical shell; at the same time, it isn't far fetched that in the spherical shell (when $n$ is large) one doesn't lose much by keeping the equatorial region and discarding the caps containing the poles. (This is explained in Andreas Blass's answer.) But this equatorial band containing most of the mass is precisely the overlap of the orthogonal equatorial regions in our 3-sphere construction.

$\endgroup$
1
  • $\begingroup$ Wonderful drawings! $\endgroup$ Commented Jan 2, 2021 at 14:00

You must log in to answer this question.

Not the answer you're looking for? Browse other questions tagged .