5
$\begingroup$

This is based on მამუკა ჯიბლაძე's (not-)answer here. I guess it is better to make up a new thread for it.
Let me repeat the setup here: We consider polynomials whose complex roots are randomly distributed in various senses (say, uniformly in a square around zero). Can something be said about the distribution of the coefficients?
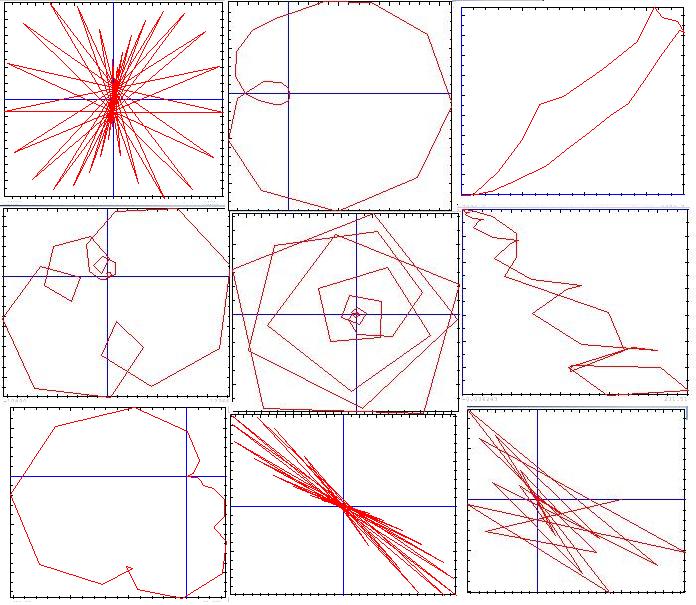
I have taken 500 random complex numbers chosen uniformly in a unit square around O, i.e. $[-\frac12,\frac12 ]\times [-\frac12,\frac12]$, and have PARI display the coefficients of the polynomial with those 500 roots. Consecutive ones are joint, and the precision \p1000 I chose should yield accurate graphics.
Doing this for several dozens of polynomials, here are some kinds of patterns that arise repeatedly. Most of them are different from those displayed by მამუკა ჯიბლაძე, though I did get cycloid-like shapes (but less "smooth") from time to time. The three rightmost ones are more irregular, which seems to occur less frequently.
enter image description here

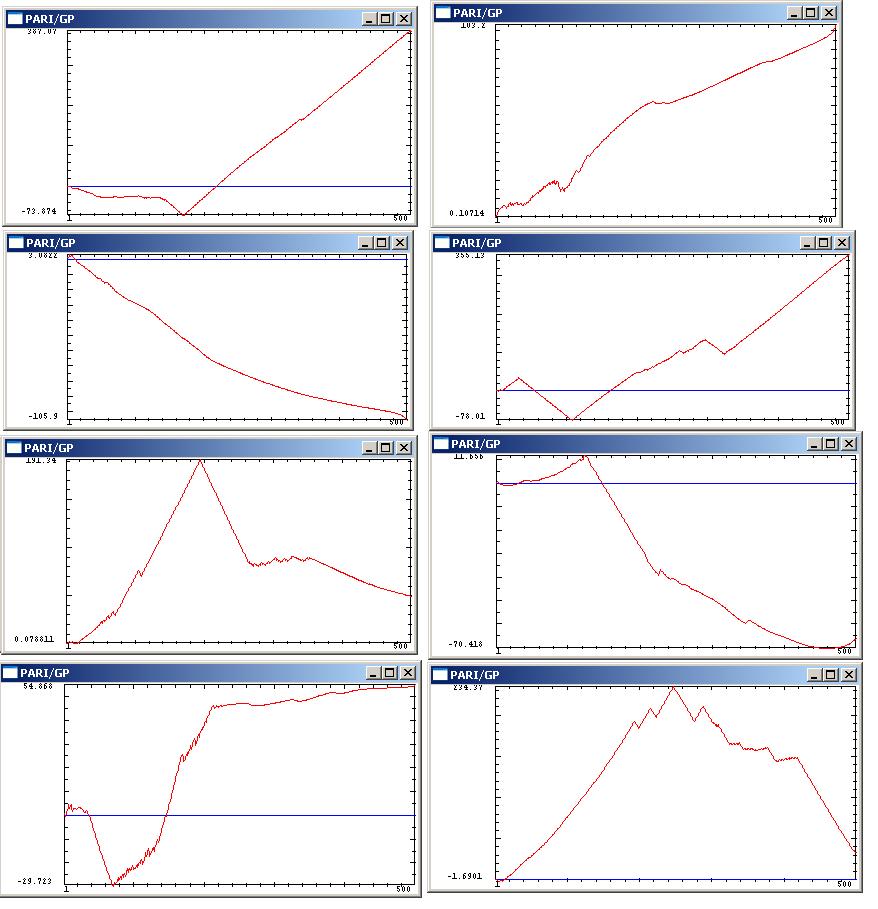
What they mostly seem to have in common is the fact that the arguments of consecutive coefficients tend to be quite equally spaced, which is why linking them yields spirals (like #2 and #5) or star-like constellations (like #1 and #8). So I have displayed the arguments of the coefficients in order. (The argument is only defined modulo $\pi$, so if the difference of two consecutive ones is $>\dfrac\pi2$ in absolute, I have corrected it by $\pm\pi$ to get rid of unnatural jumps in the display. Some of the "folds" (or "reflections") are probably still due to that, e.g. in #4 and #8 below, at places where the slope is close to $\pm\frac\pi2$.) Note that the following graphs don't correspond to the same polynomials as above, but are again chosen to give a quite representative idea of what can happen. I have included here the y-axis graduation for convenience.
enter image description here

It turns out that more often than not, the curve of arguments is approximatively "piecewise linear". Can this statistically be explained?

Note that much can be explained in a similar way as David Speyer's answer to an earlier question, but for the angles (arguments) it seems less obvious to me.

It is a good idea to divide all zeros of this "raw polynomial" $\sum c_kx^k$ by $\sqrt[n]{|c_0|}$. This planar scaling doesn't change the above angles (arguments) and makes the polynomial more "symmetric". BTW, as for the (decimal logarithms of) absolute values of the coefficients, all curves, once scaled, are close to the parabola-like one given by მამუკა ჯიბლაძე.

$\endgroup$
4
  • $\begingroup$ Could you explain how you are connecting the coefficients in the plots, which I think comes down to explaining the phrase "Consecutive ones are joint"? Thanks! $\endgroup$ Commented Oct 8, 2014 at 23:09
  • $\begingroup$ It is simply joining $c_0$ to $c_1$ to ... to $c_n$ (all complex numbers) for $p=\sum c_kx^k$. $\endgroup$
    – Wolfgang
    Commented Oct 9, 2014 at 6:10
  • $\begingroup$ Several months ago, life took me in a completely different (but ultimately related) direction: Due to some sudden and useless insight, that a binomial coefficient is a polynomial in disguise (or vice-versa), I plotted and inspected the graphic of functions of the form $f_k(x)=\displaystyle{x\choose k}$ and $g_k(x)=k!\displaystyle{x\choose k}$. What I found was that equally distributed roots make the coefficients blow up exponentially. So your discovery that equally distributed coefficients make up for an unequal distribution of roots, to the point of clustering them, makes perfect sense to me. $\endgroup$
    – Lucian
    Commented Oct 9, 2014 at 19:27
  • $\begingroup$ (And it wasn't even an original find, since Lord Stirling investigated this same topic centuries before). $\endgroup$
    – Lucian
    Commented Oct 9, 2014 at 19:29

1 Answer 1

3
$\begingroup$

I suspect both numerical issues and issues with the random number generator to be at work simulaneously.

I also get crazy values (i.e. very large ones and also some structure as shown above) for the coefficients even when I put the zeros at the $N$-th root of unity. This is seen better, the larger $N$. This suggests that the calculation of the coefficients from the roots is performed in a numerically unstable way.

My pictures of coefficients did not change qualitatively when I changed the random number generator. However, I observed a different outcome when I permuted the roots randomly and then calculated the coefficients again. They should be the same, but they were not. Moreover, the pictures looked qualitatively different. This suggests again that the computation of the coefficients is unstable and also that "permuting random coefficients randomly gives another type of random".

For example with

z = exp(2*pi*1i*(rand(N,1)));
a = poly(z);
subplot(1,2,2),plot(a,'-.'),axis equal, grid on
z2 = z(randperm(N));
z2 = z2(randperm(N));
a2 = poly(z);
subplot(1,2,1);a2 = poly(z2);plot(a2,'-.');axis equal, grid on

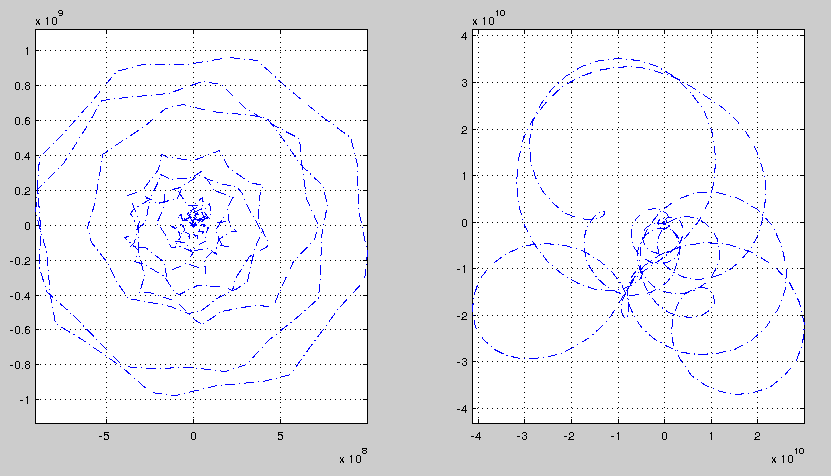
in MATLAB I got this enter image description here

(For some reason I plotted the coefficients after double repermutation of the root on the left and the coefficients of the original polynomial on the right.) In other examples the difference was not that drastically but a pointwise error between the coefficients above 10% was seen frequently.

$\endgroup$
2
  • $\begingroup$ I can follow what you say if the roots are chosen close to the roots of unity. But not for the random distribution in a square. And even close to the roots of unity, I could not reproduce what you said, unless I decrease the precision from 1000 to, say, 10 decimals. $\endgroup$
    – Wolfgang
    Commented Oct 9, 2014 at 7:49
  • $\begingroup$ Yeah sorry, I still had the question mathoverflow.net/questions/182412/… in mind. For roots in the unit square the effect I see is much smaller but still can be seen (still working with double precision floating points). I still tend to blame the random number generators; but this is far from my field and so this suspicion is not backed up… $\endgroup$
    – Dirk
    Commented Oct 9, 2014 at 8:05

You must log in to answer this question.

Not the answer you're looking for? Browse other questions tagged .