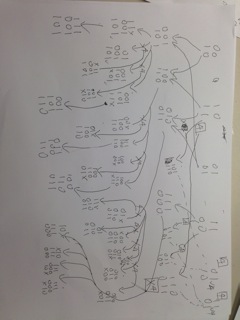
Does anyone know any kind of graph software that could produce graphs like this for publication? Those links and crosses and numbers actually needs to be presented…. Thank you:)
One small update, those 0,1s will be replaced by pictures:)

Does anyone know any kind of graph software that could produce graphs like this for publication? Those links and crosses and numbers actually needs to be presented…. Thank you:)
One small update, those 0,1s will be replaced by pictures:)

Tikz can do what you wish, if you don't mind writing LaTeX(-like) code to produce them. If you are familiar with LaTeX, it's worth your time to go through its learning curve in my opinion; it can access all of TeX's rendering capabilities natively and hence produce graphs that blend perfectly with the text style.
If you want a point-and-click graphic interface, I can suggest something like Inkscape or Dia.
Mathematica has a TreePlot function, and a LayeredGraphPlot, and you can replace the nodes with whatever graphical object or picture you want (even other graphs if you like, which I have found useful).
I once used graphviz and I think it should do what you want quite well. Essentially you edit a text file with a fairly straight forward format, and then run some compiler on it to produce the figure.