As Lasse suggests, you can draw pictures of the parameter space to help you explore the possible dynamic behavior of cubic polynomials. Any cubic polynomial is conjugate to some polynomial of the form
$$f_{a,b} = z^3 - 3a^2z + b.$$
Thus, your parameter space is four-dimensional, depending on the two complex parameters $a$ and $b$. The two critical points are always $\pm a$, thus we might decompose ${\mathbb C}^2$ into the sets of points $(a,b)$ where:
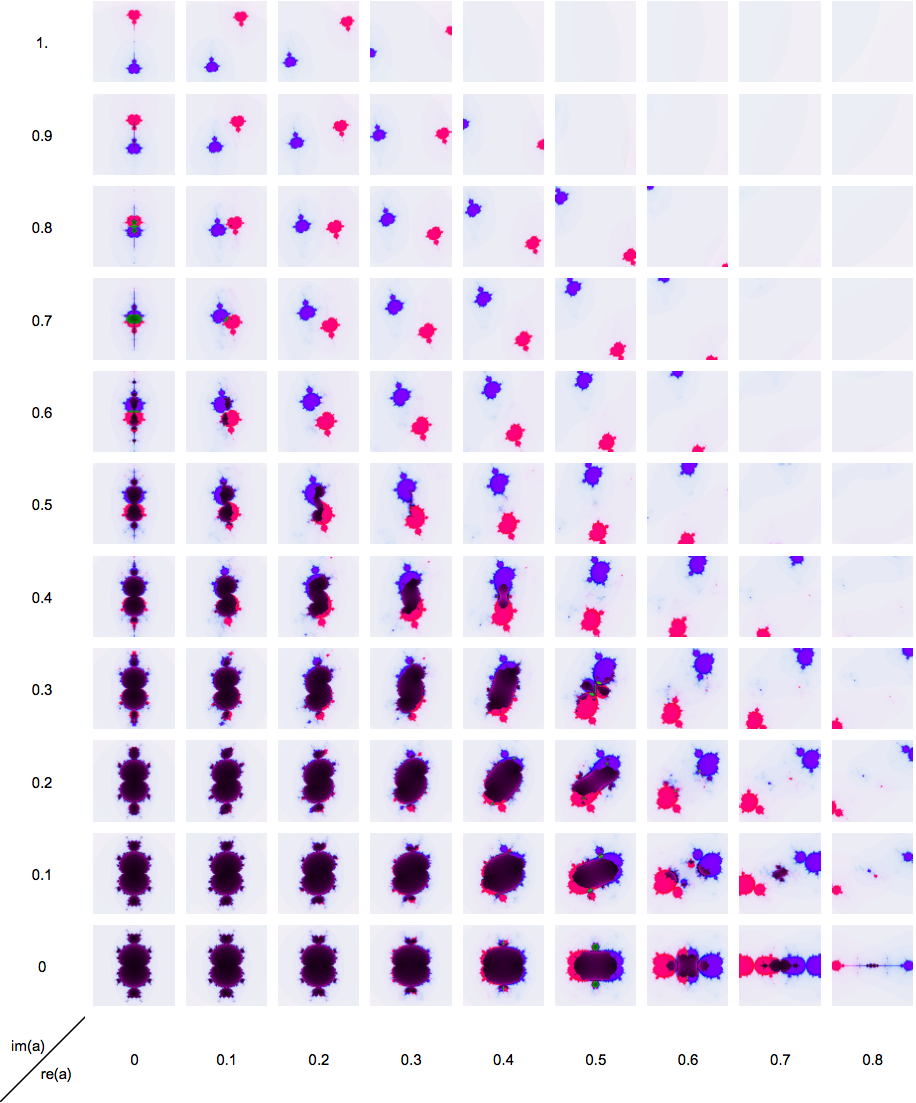
- $a$ and $-a$ both converge to the same finite orbit (deep purple)
- $a$ and $-a$ both converge to different finite orbits (green)
- $a$ escapes to $\infty$ but $-a$ converges to a finite orbit (red)
- $-a$ escapes to $\infty$ but $a$ converges to a finite orbit (blue)
- $a$ and $-a$ both escape to $\infty$ (light)
For visualization purposes, we can fix one of $a$ or $b$ while letting the other vary within a rectangle, effectively generating a two-dimensional slice of the region. Here is such an image with $a=0.575$ while $b$ ranges within $[-1.5,1.5]\times[-1,1]$. Black indicates that the classification was unsuccessful. The image is animated with the Julia set being shown for 10 different choices of the parameter $b$.

I'm confident in the images. It's fairly easy, for example, to locate parameters corresponding to super-attracting orbits and to parametrize certain parts, as the main cardioid in the Mandelbrot set can be parametrized.
If we'd like to get a grip on the entire parameter space, we can generate a grid of images for different choices of $a$; within each image, $b$ varies. Here's such a grid:

I implemented this all in Mathematica and would be happy to share the code.


