28
$\begingroup$

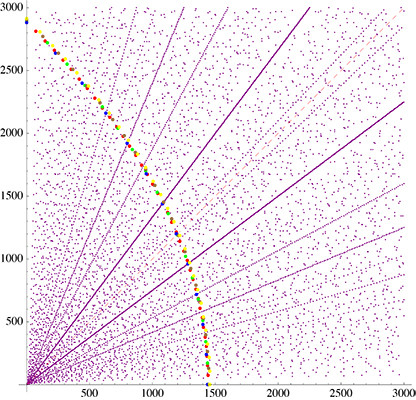
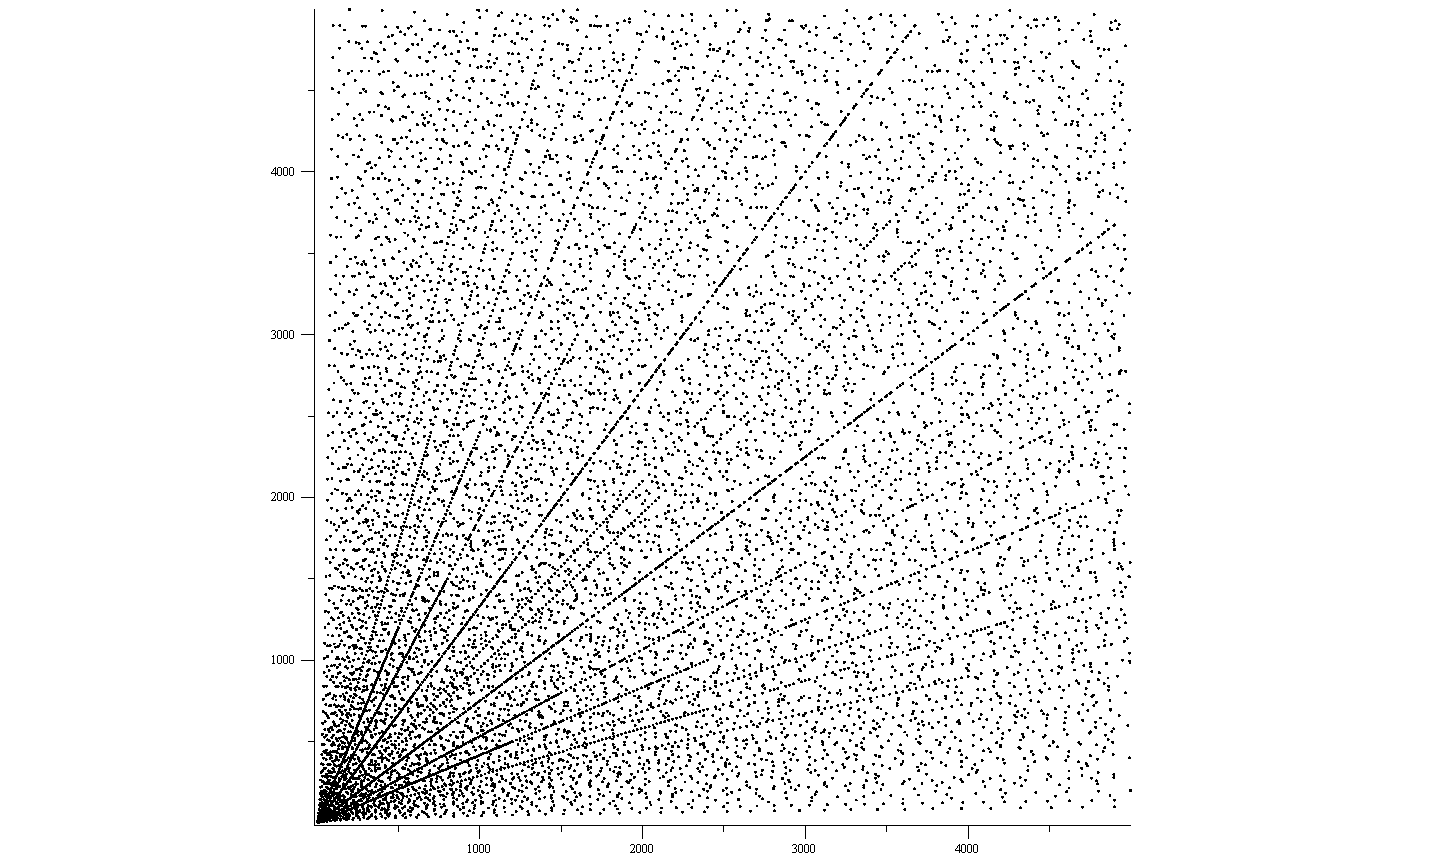
Mark each point of $\mathbb{N}^2$ ($\mathbb{N}$ the natural numbers) if its Euclidean distance from the origin is an integer. One obtains a plot like this, symmetric about the $45^\circ$ diagonal.
IntDists0
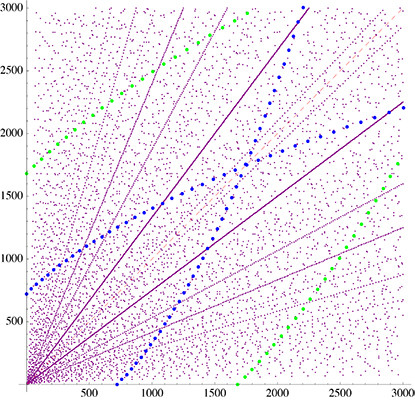
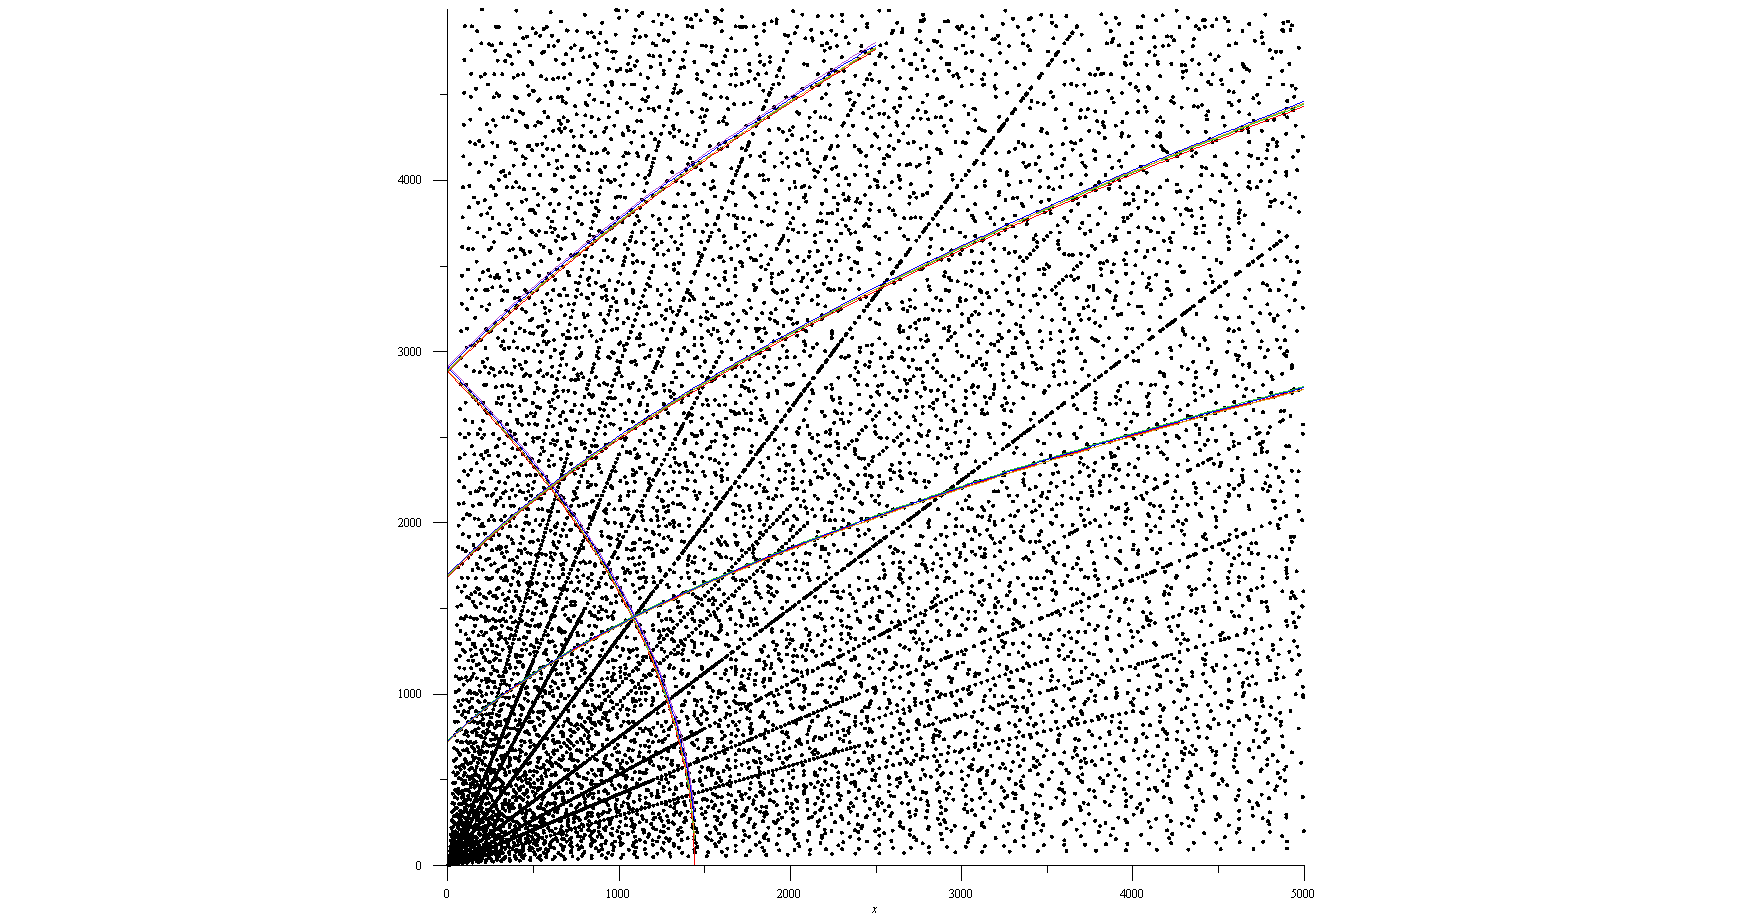
There are obvious patterns here. The straight lines through the origin are derived from scalings of Pythagorean triples: the $(3,4,5)$ triangle, the $(5,12,13)$ triangle, the $(8,15,17)$ triangle, etc. But other patterns are discernible, some of which I am perhaps hallucinating:
IntDists1
Do these patterns reflect Diophantine curves dense in integer-distance points? To what extent is, in some sense, this entire plot (extended indefinitely) understood as a union of such curves? Or do there remain unknowns lurking in here, i.e., there are sporadic points with no as-yet apparent logic behind their appearance?

(Tangentially related to the MO question, "Integer-distance sets".)


Addendum. It is now clear (after looking at plots extending further) that the blue and tan curves are actually one, crossing the diagonal, and not pinched off as I drew them.

$\endgroup$
6
  • $\begingroup$ Perhaps the green curve, (having x-intercept 2*841?)comes from the points with u=2v-29 with v greater than or equal to 29? Since 5*169 and 7*121 are close to 841 you would get 3 curves close together $\endgroup$ Commented Jul 29, 2013 at 2:48
  • $\begingroup$ @paul: I tried but failed to understand your idea here... $\endgroup$ Commented Jul 30, 2013 at 18:48
  • $\begingroup$ I was just thinking about another way of getting solution curves not too far apart. The points on the curve I mention above with v=29,30,31 and 32 are (1682,0),(1860,61),(1984,128) and (2240,201). If you replace 29 by 13 and scale by 5, you'll get the points (1690,0),(2100,145),(2550,320) and (3040,525). If instead you replace 29 by 11 and scale by 7 you get (1694,0),(2184,175),(2730,392) and (3332,651). But I doubt that any visual impression will be made; it was surely wishful thinking. $\endgroup$ Commented Jul 30, 2013 at 21:11
  • $\begingroup$ Sorry, paul, they do lie roughly on a line/curve, but not a visually prominent one, and not on the green curve I drew. $\endgroup$ Commented Jul 31, 2013 at 0:09
  • $\begingroup$ Joseph: the pattern might be clearer if it were done in Z^2 rather than N^2 where one sees the whole parabolas, and not just pieces of them, so that the two pictures you put up recently coalesce onto one. $\endgroup$ Commented Jul 31, 2013 at 11:32

6 Answers 6

12
$\begingroup$

So, as Igor points out, there will be a curve with $k+1$ lattice points $(k^2-t^2,2kt)$ running from $(k^2,0)$ down to $(0,2k^2).$ Call this the $k$-curve or better the $(k,m)=(k,1)$ curve as there are also $k+1$ lattice points $(m(k^2-t^2),2ktm).$ Of course it only makes sense to consider $m$ square-free.

Will correctly identifies the red curve as pretty much being the $(38,1)$ curve. A slight question arises as to why it seems more prominent than the $(37,1)$ or $(39,1)$ curve. My minor addition is to point out that $38^2=1444$, $5\cdot17^2=1445$ and $10 \cdot 12^2=1440$ so we are actually seeing the $(38,1),(17,5)$ and $(12,10)$ curves piled up. Perhaps too the fact that $3\cdot22^2=1452$ is close enough to throw in the $(22,3)$ curve as well. That should give $39+18+13+23=93$ lattice points. That is about what I eyeball as "close."

Also: $2\ 27^2=1458$ so these further $28$ points should probably go into the red curve or else form a very close by, nearly parallel, curve with the $23$ points from $1452$. Of course the "extra" points on the axes should perhaps be discarded but that borders on quibbling.

Similar curves to the red one, but not as dramatic, seem to be at roughly $733$ and $850.$ They latter seems to be from $29^2=841$ together with $5\cdot13^2=845.$ Maybe the former is from from $27^2=729$ together with $5 \cdot 12^2=720$ although I may have missed a better explanation.

I'd expect something from $41^2+1=2\cdot 29^2$ and it does seem to faintly be discernible.

This still leaves other colors to explain.

LATER

Consider the image of the transformation $(u,v,m) \rightarrow (m(u^2-v^2),2muv)=(x,y).$ Here we take integers $u \gt v \gt 0$ and $m$ square free. The resulting points will be have integral distance $\sqrt{x^2+y^2}=m(u^2+v^2)$ from the origin. We get all such points in the positive quadrant (some more than once). For each fixed value of $m$, lines in the $u,v$ plane go to quadrics in the $x,y$ plane. I will focus on the simplest cases (since I have not worked out the rest) $u=k$,v=k$,u-v=k$ and $u+v=k$

  • (The red curve) For $u=k$ we have $k-1$ points $(x,y)=(m(k^2-v^2),2mkv)$ on the curve $y=\sqrt{(4mk^2)(mk^2-x)}.$ Looking at all possible values $ms^2 \lt 50000$ with $s \ge 10,$ the five consecutive values $[10 \cdot 12^2,1\cdot38^2,5\cdot17^2,3\cdot22^2,2\cdot27^2]=[1440,1444,1445,1452,1458]$ stand out as particularly close together. The corresponding curves all run roughly from $(0,2800)$ to $(1400,0)$ and have a vertical separation of about $36$ at $x=300$ growing to about $46$ by $x=1100$. The only other case in that range of $5$ consecutive values separated by less than $18$ is $17$ for the first 5 of the impressive septuplet $[2873, 2880, 2883, 2888, 2890, 2900, 2904]$. By my rough count, there are about $111$ points on the first group of five curves and $149$ on the second group of seven curves , which are roughly twice as long. This explains why those seven curves rising out of the $x$-axis are not that blatant.

  • (the unseen curve) For $v=k$ we have an infinite sequence of points $(x,y)=(m(u^2-k^2),2muk)$ on the curve $y=\sqrt{4mk^2(mk^2+x)}.$ The same five values as before should give something visible if one axis or the other was pushed out to $5000$ or at least $4000.$

  • (the blue-gold curve and the green curve) Putting $u=v+j$ into $(x,y)=(2muv,m(u^2-v^2))$ we get an infinite sequence of points on the curve $y=\sqrt{(2mj^2)(mj^2+x)}.$ This curve for $(m,j)=(2s,t)$ is the same as $y=\sqrt{4mk^2(mk^2+x)}$ for $(m,k)=(s,t).$ However odd values for $m$ allow new curves. Using $(m,j)=(5,12),(2,19),(6,11)$ and $(1,27)$ gives points on the four curves $\sqrt{1440x+518400}, \sqrt{1444x+521284}, \sqrt{1452x+527076},\sqrt{1458x+531441}.$ The green curve is the result of $(m,j)=(2,29),(10,13),(14,11),(17,10)$ leading to the curves $\sqrt{2829124+3364x}, \sqrt{2856100+3380x}, \sqrt{2869636+3388x}, \sqrt{2890000+3400x}$

  • Putting $u=j-v$ into $(x,y)=(2muv,m(u^2-v^2))$ we get about $\frac{j}{2}$ points on the curve $y=\sqrt{(2mj^2)(mj^2-x)}.$ The curve for $(m,j)=(2s,t)$ is the same as the curve $y=\sqrt{(4mk^2)(mk^2-x)}$ with $(m,k)=(s,t).$ I don't immediately see it in the colored curves mentioned.
$\endgroup$
4
  • 1
    $\begingroup$ "so we are actually seeing [three] curves piled up": Brilliant! This explains a lot. $\endgroup$ Commented Jul 28, 2013 at 13:33
  • $\begingroup$ If $m$ is divisble by $u^2+v^2$, then you can get addition curves by applying the rotation $\frac 1{u^2+v^2}{u^2-v^2\,\,2uv\choose -2uv\,\,u^2-v^2}$ to a $(k,m)$ curve, although this doesn't seem to explain any of the curves you've marked. $\endgroup$ Commented Jul 30, 2013 at 18:10
  • $\begingroup$ Some of the other curves seem to be reflected versions of the $(k,m)$ curves. The green curve above looks like $(-29^2+t^2, 58t)$ with $t$ from 29 to 50 or so, and the gold/blue curve looks like $(-19^2+t^2, 38t)$ with $t$ from 19 to 58. $\endgroup$ Commented Jul 30, 2013 at 18:14
  • $\begingroup$ Very nice, @Brendan! I added your curves below Aaron's in the "answer" below. $\endgroup$ Commented Jul 31, 2013 at 0:36
5
$\begingroup$

Here are Aaron Meyerowitz's four five "piled up" curves. Red=$(38,1)$, Green=$(17,5)$, Blue=$(12,10)$, Brown=$(22,3)$, Yellow=$(27,2)$:
     Aaron's Curves


And here are Brendan Murphy's curves, $(-29^2+t^2,58 t)$ matching the green, and $(-19^2 + t^2,38t)$ tracking my original gold + blue curves.
     Brendan's Curves
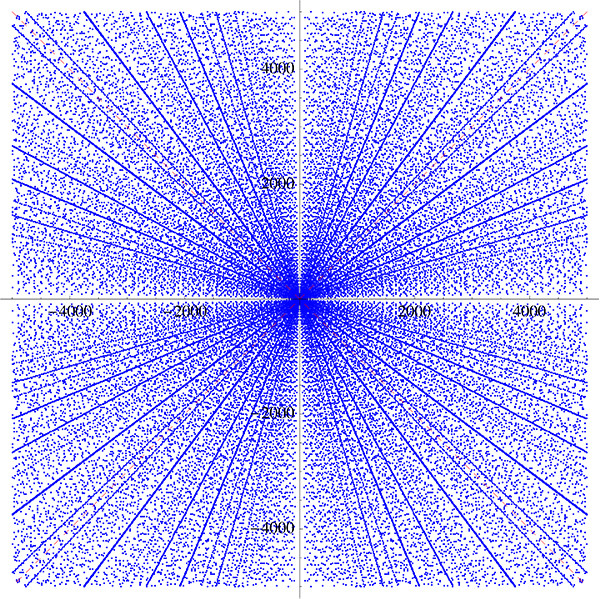
And below I follow paul Monsky's suggestion and show $\mathbb{Z}^2$ so the parabolas are more visible:
   ZxZ
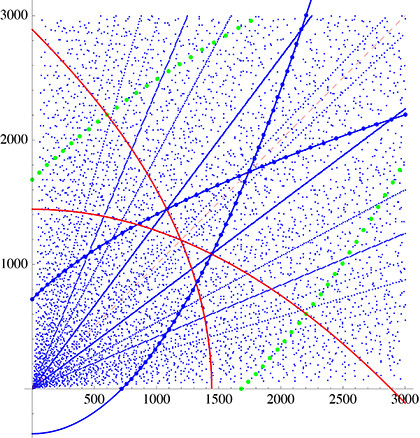
More analysis by Aaron. The red curves below are $y=2 \cdot 38 \sqrt{38^2 -x}$ (plus reflection over $x=y$), and the blue curves are $y=2 \cdot 19 \sqrt{19^2 +x}$ (plus reflection):
     Aaron Short
(The dots show Brendan Murphy's curves, previously illustrated.)

$\endgroup$
4
  • $\begingroup$ See how it looks to throw in $(27,2)$ $\endgroup$ Commented Jul 28, 2013 at 22:20
  • $\begingroup$ Any idea why there is this seeming coincidence at $m k^2 \in \{1440, 1444, 1445, 1452, 1458\}$? $\endgroup$ Commented Jul 28, 2013 at 23:24
  • $\begingroup$ From $7/5=1.4 \lt \sqrt{2} \lt 17/12= 1.41666$ we get something. And coincidences do happen. $\endgroup$ Commented Jul 29, 2013 at 3:49
  • $\begingroup$ Murray? Or Murphy? $\endgroup$ Commented Jul 31, 2013 at 6:14
4
$\begingroup$

I am a little confused. You are asking for solutions to $p^2 + q^2 = d^2,$ if I am not mistaken. If the solutions are to be relatively prime, there is a well-known parametrization of the pairs $(p, q),$ namely $(2u v, u^2-v^2)$, and of course the symmetric set $(u^2-v^2, 2 u v)$ (and the images flipping $u$ and $v.$). The non-relatively-prime solutions are multiples of these. So, presumably the curves you are seeing are rational curves coming from this, and they fill the entire solution space.

$\endgroup$
4
  • $\begingroup$ Can you say what you mean by "coming from this"? Would you have a guess for the equation of the red curve in Joseph's pic? $\endgroup$ Commented Jul 28, 2013 at 3:37
  • $\begingroup$ Is that the curve $ ( 38^2-v^2,2\cdot 38 \cdot v, 38^2 +v^2)$? $\endgroup$
    – Will Sawin
    Commented Jul 28, 2013 at 4:25
  • $\begingroup$ In fact notice that the 38 is twice a large prime. I am guessing that the curves correspond to $u$ being very "non-smooth", which means that there is a high density of $v$s relatively prime to them. $\endgroup$
    – Igor Rivin
    Commented Jul 28, 2013 at 12:33
  • $\begingroup$ The ones which are not relatively prime still give valid points, they are just a square times an earlier valid point. Part of the green story is that $\sqrt{2} \approx \frac{38}{27}$ leading to a second curve. $\endgroup$ Commented Jul 31, 2013 at 20:56
2
$\begingroup$

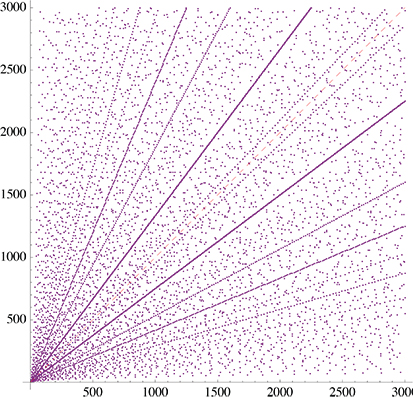
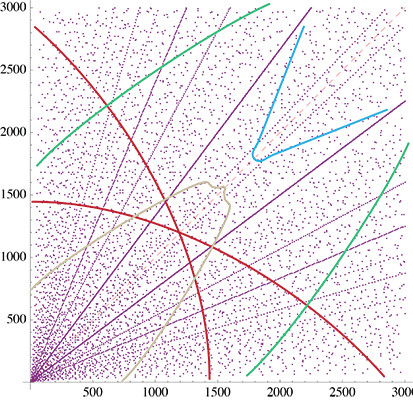
Here are the various curves from my answer:

just points

points and curves

$\endgroup$
1
$\begingroup$

I do not have an explanation, but some hints, and indeed this started as a long comment. It seems to me that there is an modelization issue to be clarified before addressing the mathematical variational problem. Why our brain preferably gather some subsets of points into an arc of curve, within the whole set of marked points in a $N\times N$ square? In other words, what mostly counts to make such a subset more recognizable as a curve to our eyes? I guess, because the curve contains more points than another, compared to its length. But possibly that is not all, as e.g. an ellipses is more visible than another random zig-zag curve with the same length and number of marked points.

So this may also turn out to be an interesting experiment in order to check a possible answer to the above question about the physiological phenomenon. For large integers $N$ consider a reasonable "visibility" functional $J_N(\alpha)$ defined on curves $\alpha:[0,1]\to [-N,N]\times [-N,N]$: for instance the number of marked points in the curve $\alpha$ divided by its length. Are maximizing curves the one we actually see, e.g the red ones? Does that functional work for other set of "marked points" than Pythagorean pairs?

$\endgroup$
1
$\begingroup$

The problem of calculating the curves which one sees in discrete point sets, reminds me of an idea that I once had in relation to the Euclidean TSP: those curves seem likely to be related to the ordering on the optimal tour - and I wanted to calculate them.

I called the task of finding those structures to calculate the "fingerprint" of a graph and, I wanted to find a solution that works for general TSP instances.

My solution looks like that:
1.) find for every pair of vertices $(u,v)$ a third vertex $w$, that minimizes the detour when going from $u$ to $w$ and then from $w$ to $v$ instead of going directly from $u$ to $v$; this corresponds to minimizing $dist(u,w)+dist(w,v)-dist(u,v)$ with respect to $w$.
2.) the previous step yields equivalency classes of edges, whose minimal detour leads over the same node.
3.) select from each equivalency class the shortest edge and connect its end points to the vertex, over which the minimal detour leads. Let's call that detour the vertex detour of the vertex over which it leads.
4.) define a graph $F$, whose vertices correspond to the detours and whose edges connect pairs from the vertex detours, if the respective detours overlap, i.e. are of the form $(r,t,s)$ and $(t,s,u)$

having identified the maximal connected components of $F$, it is easy to check various assumptions about the nature of the curves or about the reliability of one's visual perception.

There is also a way of following a smooth curve across an "intersection" with another curve:
chose from the equivalency class of the current detour's end point the shortest edge, whose detour overlaps with current one; i.e. continue $(r,t,s)$ with $(t,s,u)$ where $t$ must be contained in the equivalency class of $s$ and $(t,u)$ represents the shortest edge in that equivalency class, that is adjacent to vertex $t$.

The description of my method may be flawed; for this I apologize and ask for response.

$\endgroup$
1
  • $\begingroup$ Just a remark: the method I described can be easily generalized to higher dimensions to identify smooth manifolds; in that case the edges would be replaced by lower-dimensional simplices but the measure of shortness and the way of smooth continuation would have to be selected from various possibilities of doing it. $\endgroup$ Commented Jul 28, 2013 at 14:20

You must log in to answer this question.

Not the answer you're looking for? Browse other questions tagged .