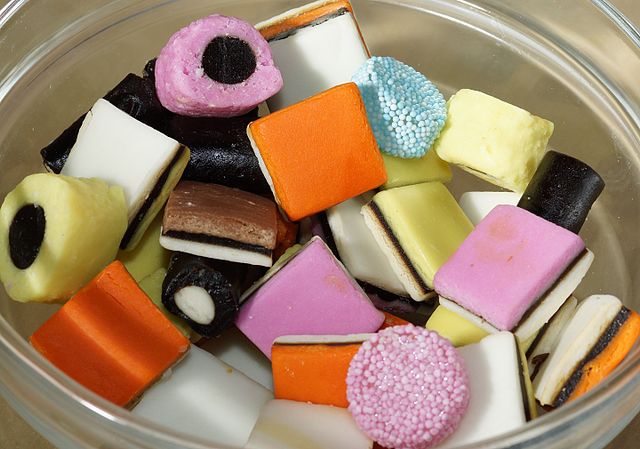
After eating a bag of liquorice allsorts in one sitting, as one does, I noticed that it had contained an unusual amount of brown ones (which, you will agree, are an abomination that should never have existed). This made me wonder: are the pieces of liquorice being mixed properly before being put into the bag?

(Picture CC-BY-SA 4.0 by David Edgar)
So I bought four bags, distributed over time and space so as not to get a biased sample of a single production batch, and counted the contents.
Let's say we have $T = 10$ types of liquorice, $B = 4$ bags, and that the count of type $t$ in bag $b$ is $c_{tb}$. Note that not every bag contains the same number of pieces of liquorice, so $n_b = \sum_t c_{tb}$ can be different for each $b$. Let's assume for now that $n_b \approx 120$ is fixed per bag index $b$, and doesn't depend on the sample.¹
I'm willing to assume that the total tally $\sum_b c_{tb}$ over the sampled $B$ bags is representative of the total distribution of types manufactured.²³ This gives us a probability $P(i) = \sum_b c_{tb} / \sum_{t,b} c_{tb}$ that a randomly sampled piece of liquorice from the assembly line is of type $t$. Our null hypothesis is that every piece of liquorice is independently⁴ drawn from this distribution.
Naively, I first asked myself: assuming the null hypothesis, what is the probability that I encountered this configuration $c$? This is pretty basic combinatorics, so I think I could write a program to calculate this on my own. But the answer would be useless; even the probability of a "very likely" configuration would be extremely low, because with about 100 pieces of liquorice in a single bag, there is a vast number of combinations.
So I suppose we should look at cumulative distributions instead: assuming the null hypothesis, what is the probability that I encountered configuration $c$ or some less likely configuration? In other words, imagine we sort all possible configurations from left to right by descending probability, how much probability mass is there to the right of my sampled configuration $c$? And that's where I'm getting stuck.
Assuming this is even the right question to ask, the number of configurations is so vast that it's impossible to calculate this with brute force, so some closed-form solution is needed. I do have some background in maths, but statistics was never my strong suit. High-level answers are fine and I'd be happy to do some reading, but I don't know where to start or what search terms to use. Can anyone point me in the right direction?
¹ In reality, the bags are probably filled up to a particular weight instead.
² Being generous to the manufacturer here.
³ Using as a baseline the types visible in the picture printed on the outside of the bag would be another interesting, and probably more damning, approach.
⁴ I.e. with replacement. We assume that the liquorice mixing bowl in the factory contains so many pieces that taking one out doesn't materially affect the distribution.
