251
$\begingroup$

I once heard a joke (not a great one I'll admit...) about higher dimensional thinking that went as follows-

An engineer, a physicist, and a mathematician are discussing how to visualise four dimensions:

Engineer: I never really get it

Physicist: Oh it's really easy, just imagine three dimensional space over a time- that adds your fourth dimension.

Mathematician: No, it's way easier than that; just imagine $\mathbb{R}^n$ then set n equal to 4.

Now, if you've ever come across anything manifestly four dimensional (as opposed to 3+1 dimensional) like the linking of 2 spheres, it becomes fairly clear that what the physicist is saying doesn't cut the mustard- or, at least, needs some more elaboration as it stands.

The mathematician's answer is abstruse by the design of the joke but, modulo a few charts and bounding 3-folds, it certainly seems to be the dominant perspective- at least in published papers. The situation brings to mind the old Von Neumann quote about "...you never understand things. You just get used to them", and perhaps that really is the best you can do in this situation.

But one of the principal reasons for my interest in geometry is the additional intuition one gets from being in a space a little like one's own and it would be a shame to lose that so sharply, in the way that the engineer does, in going beyond 3 dimensions.

What I am looking for, from this uncountably wise and better experienced than I community of mathematicians, is a crutch- anything that makes it easier to see, for example, the linking of spheres- be that simple tricks, useful articles or esoteric (but, hopefully, ultimately useful) motivational diagrams: anything to help me be better than the engineer.

Community wiki rules apply- one idea per post etc.

$\endgroup$
13
  • 49
    $\begingroup$ ... from which I can only draw the conclusion that at least one mathematician has an uncountable amount of wisdom and experience. Kinda makes me jealous, really... $\endgroup$ Commented May 26, 2010 at 11:54
  • 75
    $\begingroup$ Your joke reminds me of Burt Totaro's algebraic topology class, it must have been in 2001. He drew the standard picture of a 2-sphere on the board and wrote '$S^2$' next to it, but quickly started to discuss n-spheres. Someone put up their hand and asked 'What's an n-sphere?' Burt responded 'Oh it's easy, you just do this', erased the '2' on the board, replaced it by an 'n', and carried on talking. $\endgroup$
    – HJRW
    Commented May 26, 2010 at 19:25
  • 36
    $\begingroup$ Not a great joke?!? That's basically the punchline for the funniest math joke I ever heard (usually they are such groaners). A mathematician and engineer go to a physics talk where the speaker discusses 23-dimensional models for spacetime. Afterwards the mathematician says "that talk was great!" and the engineer is shaking his head and is very confused: "The guy was talking about 23-dimensional spaces. How do you picture that?" "Oh," says the mathematician, "it's very easy. Just picture it in n dimensions and set n = 23." Laughed my a** off when I first heard that. $\endgroup$
    – KConrad
    Commented May 27, 2010 at 0:06
  • 52
    $\begingroup$ There's a great joke that I'll repeat (abridged) from the joke topic: "A mathematician who studied a very abstract topic was annoyed that his peers in more applied fields always made fun of him. One day he saw a sign "talk today on the theory of gears", and said to himself "I'll go to that! what could be more practical than a talk on gears?" He arrives at the talk, eager to learn applicable knowledge. The speaker goes up to the podium and addresses the crowd: "Welcome to this talk on the theory of gear. Today I will be speaking about gears with an irrational number of teeth." $\endgroup$
    – DoubleJay
    Commented May 28, 2010 at 3:40
  • 35
    $\begingroup$ "To deal with a 14-dimensional space, visualize a 3-D space and say 'fourteen' to yourself very loudly. Everyone does it." -- Geoff Hinton, man who goes directly to third Bayes. $\endgroup$
    – Bella I.
    Commented Oct 5, 2014 at 6:48

29 Answers 29

141
$\begingroup$

I can't help you much with high-dimensional topology - it's not my field, and I've not picked up the various tricks topologists use to get a grip on the subject - but when dealing with the geometry of high-dimensional (or infinite-dimensional) vector spaces such as $\mathbb R^n$, there are plenty of ways to conceptualise these spaces that do not require visualising more than three dimensions directly.

For instance, one can view a high-dimensional vector space as a state space for a system with many degrees of freedom. A megapixel image, for instance, is a point in a million-dimensional vector space; by varying the image, one can explore the space, and various subsets of this space correspond to various classes of images.

One can similarly interpret sound waves, a box of gases, an ecosystem, a voting population, a stream of digital data, trials of random variables, the results of a statistical survey, a probabilistic strategy in a two-player game, and many other concrete objects as states in a high-dimensional vector space, and various basic concepts such as convexity, distance, linearity, change of variables, orthogonality, or inner product can have very natural meanings in some of these models (though not in all).

It can take a bit of both theory and practice to merge one's intuition for these things with one's spatial intuition for vectors and vector spaces, but it can be done eventually (much as after one has enough exposure to measure theory, one can start merging one's intuition regarding cardinality, mass, length, volume, probability, cost, charge, and any number of other "real-life" measures).

For instance, the fact that most of the mass of a unit ball in high dimensions lurks near the boundary of the ball can be interpreted as a manifestation of the law of large numbers, using the interpretation of a high-dimensional vector space as the state space for a large number of trials of a random variable.

More generally, many facts about low-dimensional projections or slices of high-dimensional objects can be viewed from a probabilistic, statistical, or signal processing perspective.

$\endgroup$
5
  • 2
    $\begingroup$ This is an amazing answer. Thank you. $\endgroup$ Commented May 12, 2012 at 20:14
  • $\begingroup$ What is meant by "real-life" measures? $\endgroup$ Commented Mar 6, 2017 at 15:09
  • 3
    $\begingroup$ +1. Could you please elaborate in details on the second last paragraph regarding interpreting using the law of large numbers? Thank you! $\endgroup$
    – Hans
    Commented Jun 20, 2018 at 20:34
  • $\begingroup$ @Hans I'm curious too, so I posted a question on Math.SE: math.stackexchange.com/questions/3239496/… $\endgroup$
    – nalzok
    Commented May 27, 2019 at 15:56
  • 4
    $\begingroup$ Sorry, perhaps the more accurate statement is that the law of large numbers implies that most of the mass of a gaussian measure (which can be thought of as a smoothed out version of a ball) lurks near a single sphere. (And similarly for most of the mass of a large cube.) It is still true that most of the mass of a large ball lurks near the boundary sphere, but to the probabilistic explanation of this is closer in spirit to large deviations than to the law of large numbers. $\endgroup$
    – Terry Tao
    Commented May 27, 2019 at 20:09
104
$\begingroup$

Here are some of the crutches I've relied on. (Admittedly, my crutches are probably much more useful for theoretical computer science, combinatorics, and probability than they are for geometry, topology, or physics. On a related note, I personally have a much easier time thinking about $R^n$ than about, say, $R^4$ or $R^5$!)

  1. If you're trying to visualize some 4D phenomenon P, first think of a related 3D phenomenon P', and then imagine yourself as a 2D being who's trying to visualize P'. The advantage is that, unlike with the 4D vs. 3D case, you yourself can easily switch between the 3D and 2D perspectives, and can therefore get a sense of exactly what information is being lost when you drop a dimension. (You could call this the "Flatland trick," after the most famous literary work to rely on it.)

  2. As someone else mentioned, discretize! Instead of thinking about $R^n$, think about the Boolean hypercube $\lbrace 0,1 \rbrace ^n$, which is finite and usually easier to get intuition about. (When working on problems, I often find myself drawing $\lbrace 0,1 \rbrace ^4$ on a sheet of paper by drawing two copies of $\lbrace 0,1 \rbrace ^3$ and then connecting the corresponding vertices.)

  3. Instead of thinking about a subset $S \subseteq R^n$, think about its characteristic function $f : R^n \rightarrow \lbrace 0,1 \rbrace$. I don't know why that trivial perspective switch makes such a big difference, but it does ... maybe because it shifts your attention to the process of computing $f$, and makes you forget about the hopeless task of visualizing S!

  4. One of the central facts about $R^n$ is that, while it has "room" for only $n$ orthogonal vectors, it has room for $\exp(n)$ almost-orthogonal vectors. Internalize that one fact, and so many other properties of $R^n$ (for example, that the $n$-sphere resembles a "ball with spikes sticking out," as someone mentioned before) will suddenly seem non-mysterious. In turn, one way to internalize the fact that $R^n$ has so many almost-orthogonal vectors is to internalize Shannon's theorem that there exist good error-correcting codes.

  5. To get a feel for some high-dimensional object, ask questions about the behavior of a process that takes place on that object. For example: if I drop a ball here, which local minimum will it settle into? How long does this random walk on $\lbrace 0,1 \rbrace ^n$ take to mix?

$\endgroup$
4
  • $\begingroup$ How does (4) follow from Shannon's theorem, which has to do with discrete codes rather than $R^n$? I think (4) is much more naturally thought of as a consequence of the Johnson-Lindenstrauss lemma, which is itself intimately connected to Dvoretzky's theorem. The latter, btw, is probably a natural candidate for "the one weird fact you need to know about high-dimensional Banach spaces". $\endgroup$ Commented May 22, 2016 at 13:00
  • 10
    $\begingroup$ What is an almost-orthogonal vectors? $\endgroup$
    – FNH
    Commented Jan 31, 2017 at 23:26
  • $\begingroup$ Neat set of practically useful techniques, thanks. $\endgroup$
    – avocade
    Commented Mar 15, 2017 at 13:54
  • 2
    $\begingroup$ @FawzyHegab See this question, or just search "almost orthogonal vector exponential" $\endgroup$ Commented May 28, 2019 at 6:05
58
$\begingroup$

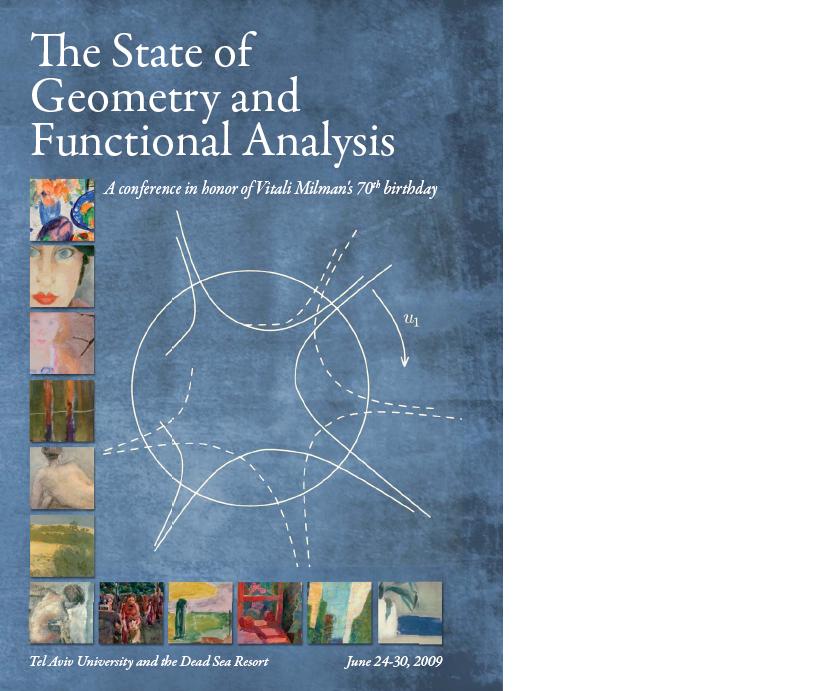
This is a slightly different point, but Vitali Milman, who works in high-dimensional convexity, likes to draw high-dimensional convex bodies in a non-convex way. This is to convey the point that if you take the convex hull of a few points on the unit sphere of R^n, then for large n very little of the measure of the convex body is anywhere near the corners, so in a certain sense the body is a bit like a small sphere with long thin "spikes".

enter image description here

$\endgroup$
36
$\begingroup$

In general one uses a combination of projection, movie, and analogy from lower dimensions. I will try and exemplify each. Also, and importantly, think about linear algebra as an intrinsically geometric description. I will start from the last point first.

The solutions to a single linear equation in (n+1) unknowns can be thought of as defining a hyperspace of n-dimensions in (n+1)-space. It also is the intersection between the graph of a function $y=\sum a_i x_i$ and the constant function $y=b$. Row reduction is trivial to implement, but gives a basis for the solution space of the associated homogeneous. Continue adding equations (generically) and continue to cut down the dimensions.

Similarly, the binomial theorem expresses the volume of an n-dimensional cube in terms of a bunch of slices. I drew a picture here: http://www.southalabama.edu/mathstat/personal_pages/carter/binon.pdf and here: http://www.southalabama.edu/mathstat/personal_pages/carter/pascalscube1.pdf

By a similar construction you can convince yourself that $\int_0^1 x^n dx = 1/(n+1)$ by considering the left hand side to be a pyramid in the (n+1)-cube. A total of (n+1) of these fill the (n+1)-cube. Abhijit Champanerkar and I posted a paper on the arXiv on that.

In terms of projections, movies and analogies, consider a classical knot such as the braid closure of the braid word $s_1^3$. The movie of this consists of two pairs of points being born and a pair of these points dance about. The most immediate picture that I can think of is in a recent paper of Joan Licata in JKTR. The movie seems boring and hard to parse, but if you keep track of all details you can reconstruct the projection and the diagram (these two ideas are different: the diagram contains crossing information).

Many knot theorist, when drawing a slice knot and disk, draw a circle with a pair of points connected by a bent chord in the interior. This is using the dimension analogy: you draw the analogue one dimension down rather than up.

For knotted and linked surfaces, you can draw a movie which contains knots and links dancing, mating, and separating: bacterial voyeurism. When you draw this AND you keep careful track of critical information, you can reconstruct an accurate picture of the projection. We tell how to do this in the AMS book and the Springer book. See also my draft of the sphere eversion on page linked above but beware: the file is huge!!!

If you want to study knots and links of 3-manifolds in 5-space you can make a movie of surfaces dancing. Singularity theory will help keep track of things.

Finally remember when you draw a surface onto the plane you loose information. When you draw a solid in the plane, the information is contained in segments that are parallel to the kernel of linear approximations. These patterns persist. The standard projections of a hypercube contain a 2-d kernel.

To summarize: Think about linear algebra geometrically. Take cross sections and use these to reconstruct projections, and consider carefully the information lost in the projections.

$\endgroup$
35
$\begingroup$

One way I always liked to think of $S^n$ is in terms of suspensions. While not particularly geometrically enlightening (though it can be topologically enlightening), is still an interesting way to think of them.

Definition. The suspension $SX$ of a topological space $X$ is $(X\times[0,1])/\sim$ where $\sim$ collapses $X\times${0} to a point and $X\times${1} to a point. "Geometrically", this means we want to take $X$, and two "suspension" points, and then draw "lines" from the two points to all the points in $X$.

So we can imagine the suspension of the circle easily. $S^1\times[0,1]$ is the cylinder, and $S^1 \times${0} is the circle on the "bottom" of the cylinder, and $S^1\times${1} is the circle at the "top". We identify these circles with points, which collapses the top and bottom of the cylinder to points. This clearly gives us $S^2$!

Generally, it is not hard to show $SS^n = S^{n+1}$.

So, now let's try to imagine $S^3$, which is three dimensional, so shouldn't be too hard to think about. We start with the 2-sphere, considered embedded in $\mathbb{R}^3$, and two "suspension" points. But we can already tell this is going to look weird if we choose two points, say, above the north and south poles. So, let's pick one point inside the sphere.

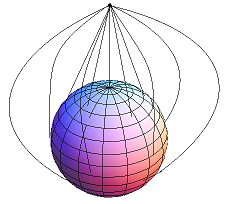
The set of all lines from the point in the center of the sphere to the sphere is the solid sphere. Now, we want to deal with the second point. Say, we place this above the north pole, and connect each point on the sphere to it.

enter image description here

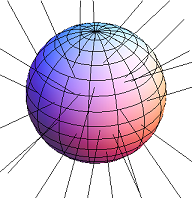
Since these lines are supposed to go to all points of the sphere, we should imagine this diagram shows the lines dense in the space around the sphere... but this is looking crowded, so let's move this extra point all the way off to infinity, and redraw this picture,

enter image description here

again imagining in this crudely drawn picture the lines cover the whole sphere.

But now these lines cover, in addition to the surface of the sphere and the point in the center, all of $\mathbb{R}^3$! And, all we've got left is the point at infinity.

So, we've just shown $S^3$ is $\mathbb{R}^3\cup$ {$\infty$}.

Now, how can we imagine $S^4$? We do the same thing again! Draw all lines (this time, since we can't quite imagine the bigger space to embed this in, we can instead think of formal linear combinations) from two points to every point in $\mathbb{R}^3$, and to the extra point at infinity.

I won't try to draw that one, but, thinking of it isn't too hard (although things get geometrically confusing if you try to do this process too many times!) But at the very least, you can convince yourself the spheres all have a relatively simple structure.

Generically, one can construct other spaces by suspensions, cones (suspensions over one point), joins (drawing lines between two arbitrary topological spaces), wedges ($\vee$) (quotient of disjoint unions), and smash products $X\times Y/X\vee Y$, which, with are simple enough that in some cases, with enough effort, one can use them to visualize what lots of types of higher dimensional spaces look like! For more, grab your favorite algebraic topology book.

If it helps make sense of this explanation, I'm a physicist ;).

$\endgroup$
3
  • $\begingroup$ The images aren't available. $\endgroup$ Commented Oct 5, 2014 at 8:57
  • $\begingroup$ @MartinBrandenburg: Worse, now they're showing ads instead. I'm going to edit them out; hopefully the original author can replace them with properly hosted versions. $\endgroup$ Commented Aug 17, 2015 at 17:59
  • 4
    $\begingroup$ I used archive.org to retrieve the images: I hope they are right now. $\endgroup$ Commented Aug 31, 2015 at 20:27
28
$\begingroup$

This post is not a direct answer to your question, but rather a movie recommendation.

"Dimensions" try to help you visualize the 4th dimension by projecting it onto the familiar two and three dimensions. It also contains a part depicting two-dimensional beings trying to conceive of a third dimension, so that the viewer can visualize the easier and analogous situation first.

The graphics are pretty and it is totally free. Check it out!

Dimensions, movie

$\endgroup$
28
$\begingroup$

Any kind of varying visual property of a surface (e.g. color, texture, opacity) can be used to describe one extra dimension. This really only helps in low dimensions, but it's quite effective!

To give an example, Hatcher describes visualizing the embedding of the Klein bottle into four space by letting most of the bottle be blue, but having it "blush" as it passes through itself.

$\endgroup$
3
  • $\begingroup$ What are the different types of embeddings of the Klein bottle into four space -- for instance, in what ways is a Klein bottle that is blue all over except for the blush different from a rainbow colored Klein bottle? $\endgroup$ Commented May 27, 2010 at 23:19
  • 1
    $\begingroup$ You can color it any way you want and it'll basically be the same, so long as 1) the parts with spatial overlap have different colors and 2) the colors (i.e. position in 4th dimension) are continuous. $\endgroup$
    – DoubleJay
    Commented May 28, 2010 at 3:55
  • 1
    $\begingroup$ DoubleJay, I don't think that can be right: there must be more than one embedding of a Klein bottle in $\mathbb{R}^4$. Maybe it's true that if there's only a single circle of self-intersections then it's a standard embedding? $\endgroup$ Commented May 12, 2012 at 15:14
19
$\begingroup$

In "Regular polytopes", H.S.M. Coxeter writes:

Only one or two people have ever attained the ability to visualize hyper-solids as simply and naturally as we ordinary mortals visualize solids, but a certain facility in this direction may be acquired by contemplating the analogy between one and two dimensions, then two and three and so (by a kind of extrapolation) three and four. This intuitive approach is very fruitful in suggesting what results should be expected. However, there is some danger of being led astray unless [...]

You should read the whole section 7.1 to find out. As a bonus you will find there the following quote by Poincaré, whose origin I am afraid I was unable to verify:

Un homme qui y consacrerait son existence arriverait peut-être à se peindre la quatrième dimension.

$\endgroup$
17
$\begingroup$

One extremely useful trick for visualising a certain class of simple 4- and 6-dimensional spaces is the toric moment map picture.

(a) The basic example is a 2-sphere $\{x^2+y^2+z^2=1\}$, which you equip with a linear height function $(x,y,z)\mapsto z$. Now instead of drawing the sphere you draw its image (an interval). Under this map, the sphere is a family of circles being collapsed to points.

(b) The next basic example is $S^2\times S^2$, which maps to a square: away from the edges, the preimage of a point is a 2-torus; over the edges away from the corners the preimages are circles; over the corners the preimages are points. Over each edge, there is a sphere whose projection to that edge is the one we saw in (a). The diagonal sphere $\{(x,x)\ :\ x\in S^2\}$ (respectively antidiagonal sphere $\{(x,-x)\ :\ x\in S^2\subset\mathbf{R}^3\}$) map to the diagonal/antidiagonal in the square and intersect each torus fibre in the diagonal/antidiagonal circle.

(c) $\mathbf{CP}^2$ with homogeneous coordinates $[x:y:z]$ projects to a triangle $\{a+b\leq 1,\ a,b\geq 0\}$ via $[x:y:z]\mapsto(|x|^2/T,|y|^2/T)$, $T=|x|^2+|y|^2+|z|^2$. Over each edge there is a sphere: you usually think of the sphere over the hypotenuse as being ``at infinity'' ($z=0$). These spheres are complex lines. If you cut out the spheres living over edges, everything retracts down to the fibre over the barycentre (which is again a torus).

In general what you're drawing is the image of a symplectic $2n$-manifold $X$ with a Hamiltonian action of the $n$-dimensional torus $T$ (in these cases, $n=1,2$) under the map $X\to X/T$. This is always a convex polytope whose vertices and be $\mathbf{Z}$-linearly identified with the vertex of the positive orthant in $\mathbf{R}^n$ (the Delzant property). A six-manifold projects to a 3-d polytope: $\mathbf{CP}^3$ becomes a standard simplex, for example. Various natural operations like blow-up can be easily visualised (chopping off corners of polytopes); certain natural singularities can be understood (by allowing non-Delzant vertices), for example the small resolution and flop of a 3-fold node has a nice toric picture (see the picture near the end of this blog post). High degree algebraic curves can be visualised using their amoebas.

Even more generally (as others in this thread have said), high-dimensional spaces can be visualised by their projections to other, simpler spaces. The most interesting and important part of this information is the singularities of the projection maps. This is the moral of Morse theory, Cerf theory, Picard-Lefschetz theory and, in this instance, of toric geometry, where the singularities of the moment maps occur along the faces and edges of the image polytope and give you a rich collection of important submanifolds for free.

More philosophically, I would say the key in developing a geometric intuition is in learning to draw simplified, lower-dimensional and possibly misleading pictures, provided you understand exactly how misleading the pictures are. For example, in the above example the diagonal and antidiagonal are disjoint in $S^2 \times S^2$ but their images intersect in the square.

$\endgroup$
13
$\begingroup$

One way is to relax right angles. I.e., imagine 4d space without orthogonal bases.

Take a pyramid. The top point is the origin. Each of the edges that run down the sides are axes. Let's call them x-, y-, z- and w-.

Imagine a line from the origin to the middle of the square base at the bottom. That is the x = y = z = w line.

A pentagonal pyramid would suffice for 5d. And interestingly enough, a cone would suffice for infinite-d. It's sometimes helpful to think that each of these axes 'act' on the line or planar 'shape' (the, x = y = z = w line is perhaps one of the simplest, but of course any equation can be visualized within the pyramid or cone...).

One other thing to note, however, is that this is just one 'view' or projection of 4d space into 3d space. Real orthogonal 4d geometric space isn't (I don't think) viewable in orthogonal 3d geometric space. We can only see a projection of what it looks like.

$\endgroup$
1
  • $\begingroup$ My mathematics background is pretty thin. Most of the other answers scramble the last sane neuron I have left, however I have used this same technique described here, but just using the spokes on a flat 2D plane. What is interesting is if you connect all the co-ordinates with lines, every point in the N dimensional space produces a unique 2D shape. $\endgroup$
    – n4rzul
    Commented Dec 29, 2017 at 7:30
13
$\begingroup$

In 5 or more dimensions handlebody decomposition and the associated handle moves. In dimension 4 Kirby calculus. In dimension 3 Heegaard splittings. (Dimensions less than 3 are left as an exercise for the interested reader.)

Handlebody decomposition and the associated handle moves are covered elegantly in Kosinski's Differential Manifolds while Kirby calculus is covered in Stipsicz and Gompf's 4-Manifolds and Kirby Calculus. Both books touch upon Heegaard splittings.

$\endgroup$
11
$\begingroup$

There is a system of visualizing the fourth dimension using colored cubes which is in an appendix of The Fourth Dimension a book by Hinton on the fourth dimension. That book is available on google books.

One famous student of the Hinton was Alice Boole. She learned the system and used her abilities to visualize figures in the fourth dimension to publish several papers. She later married a Mr. Stott so she may also be referred to as Mrs. Stott in some writings referring to her work. Here is a chapter in a dissertation which is about her work.

$\endgroup$
9
$\begingroup$

Great question, and a lot of good answers. I had the same question very long ago and spent quite some effort writing interactive 3D software showing 4D objects projected into 3-space in order to see how much true 4D visualization is possible in the way that we easily understand 3D. After many years I realized that it is really impossible, for the simple reason that we evolved in a 3D world. Computers have no problem handling any number of dimensions but that's because they evolved to answer questions about all sorts of abstract math. This is not to say that we can't develop some very good intuitive understandings of 4D objects from their 3D shadows. I'm just saying that I'm convinced that no one can visualize 4D like most people effortlessly visualize 3D.

My best suggestion is to spend some time using the 4 dimensional Rubik's cube that a friend and I developed called MagicCube4D. You don't need to try to solve the full puzzle. First just rotating it around in 4-space (shift-dragging) will eventually help you to at least know what to expect from its resulting projections. Working to solve cubes scrambled with just one or two random twists is a great exercise to further train your brain to the point where it is largely effortless. It really helps to have something to actually do in 4-space as opposed to just watching projections bend and morph as they rotate.

Even though well over 100 people have solved the full 3^4 puzzle, none of them really grok the object in itself, but they become extremely comfortable and adept in manipulating it. Perhaps one key thing to note is that this puzzle only shows you the 3D "faces" of a 4D cube. We can fully understand this hyper-surface, but the volume of 4-space that it contains is still completely baffling to me. My sense is that this is about the best that we can hope to achieve.

$\endgroup$
0
7
$\begingroup$

"Dimensions" series has already been mentioned, and it is absolutely fabulous, but I feel that "Not knot" is closer to the spirit of the question. Yes, it is takes place in "only" 3 dimensions, but there is plenty to learn there already. I hope that I remember it correctly: Thurston said that you need to understand geometry of a manifold from the inside, and that is what the movie is about. Oh, how I wish that the Geometry Center continued to function and produced more...

$\endgroup$
1
  • $\begingroup$ Indeed, the disappearance of the Center is a rather inexplicable event! $\endgroup$ Commented May 28, 2010 at 7:32
7
$\begingroup$

For 4-dimensional convex polytopes, Schlegel diagrams are a highly intuitive crutch. See:

http://en.wikipedia.org/wiki/Schlegel_diagram

Also, there's an online excerpt from Gunter Ziegler's "Lectures on Polytopes" that has a chapter discussing Schlegel diagrams.

$\endgroup$
5
$\begingroup$

This is not so much a crutch as a way to explore the upper bound of purely visual exploration of space : Jeff Weeks has made a nice computer program which allows one to fly around some compact 3-manifolds. I find it a nice way to get some intuition of global topological feature in higher dimensions.

http://www.geometrygames.org/CurvedSpaces/index.html.en

$\endgroup$
5
$\begingroup$

My standard answer to how I understand 4D is to say that I realise I do not understand 3D and go from there. This is glib, but I think it does conceal a trick that I do use. That is to stop trying to see in 4d. There have been perhaps a handful of people who could actually work in a purely intuitive manner in 4d space. For most of us even quite simple questions (such as the intersection of cylinders in 3 different directions) in 3d require a lot of thought.

By giving up on trying to actually see the whole 4d picture it is then possible to bring in many of the tricks (such as the jump from 2d to 3d) and other methods of the abstract. Sometimes you can do a lot simply with linear algebra.

Most of the work I have done in higher dimensional spaces has been considering projection tilings like the Penrose tiling, where the higher space is naturally split into two smaller spaces. So don't forget that as well as looking at 3+1, looking at 2+2 can sometimes be handy, or even a longer list of 2 and 3d projections or views on your object. After all this is how we often end up working on 3d things!

$\endgroup$
5
$\begingroup$

Descriptive geometry used to be taught to engineers, not so often now that we have computer drawing software. The idea is to project 3D objects onto TWO half-planes, then flatten the half planes into a sheet of paper. There is a redundant dimension in the representation.

This can be exploited to visualize 4 dimensions: simply project a 4D object onto 2 planes. Descriptive geometry with both half-planes independent. One can go up to 6 dimensions by projecting onto 3 planes, or onto 2 volumes. The trick does help somewhat.

$\endgroup$
4
$\begingroup$

The way I do it is simpler than all these other answers, it's just my way, I'm not claiming it's better. What I do is just remove the idea of "physical space" from the idea of "dimensions." I define "dimension" as "independently changeable variable." Then physical cartesian space is just a special case of something with three dimensions, which are the three independent directions you can move in, X, Y and Z, without moving in another of the others. For example, you can change your X position freely, without changing Y or Z. So your position in space is defined by 3 independent variables. So the extents of three dimensional space is described by all the possible values of three independent variables in every combination. To get to four dimensions, you can just get rid of the idea of spatial relation, and just accept this idea that a "space with four dimensions" is just all the possible values of four independent variables in every combination. Tada! This might seem disorienting at first, but it works fine, and you don't have to deal with ideas like orthogonality or any real hard math at all, which is a good thing for me.

$\endgroup$
1
  • 5
    $\begingroup$ This idea isn't wrong or anything -- it's just that "everyone" knows it. ("Everyone" here means the intended audience of MO, consisting of professional mathematicians and their graduate students.) In fact, this is essentially the mathematician's answer given in the joke of the OP. What the OP is asking for are ways to augment the spatial intuition one has for three dimensions, ones that take advantage of the visual sense. $\endgroup$ Commented Mar 5, 2015 at 12:04
4
$\begingroup$

Here is a smart way to visualize 4 dimensions: play to the card game SET. It goes that way : each card displays a number of symbol(s), with a colour and a shading. Each quality can take three possible values; for instance, the card can be blue, red or green (difficult for blind-colour people like me), it can contain one, two or three symbol(s). All combinations happen exactly once. Therefore the deck of cards is isomorphic to the $4$-dimensional affine space upon ${\mathbb F}_3$ ($81$ cards). The rule is written for engineers, but a mathematician can translate them as follows: in a given set of points (usually $12$ points), find an affine line (a set).

$\endgroup$
4
$\begingroup$

This is more of a joke. We see the world in 3D by moving our eyeballs. All movements of an eye are locally described by the Lie group SO(3). Similarly, to "see" things in 4D we need to get info from SO(4)-parametrized set of directions. But SO(4) is locally isomorphic to SO(3) x SO(3), so it is enough to teach our eyes to move independently! (Chameleons do that!)

$\endgroup$
2
$\begingroup$

I have often wondered if it would be useful to have a computer graphic generated, of several objects,each showing three-dimensions and sufficient in number to show the required number of dimensions. If one such object could be rotated with others moving in sync, it should give an intuitive grasp of an object's properties.

$\endgroup$
1
  • 2
    $\begingroup$ You can do things like this in mathematica pretty easily. You can just put the coordinates in an n-dimensional vector, hit it with a rotation matrix, and draw 3-dimensional cross-sections or projections. Surprisingly, it's more confusing than insightful much of the time. But you can find examples of stuff like this on the wolfram demonstrations site, e.g., demonstrations.wolfram.com/CalabiYauSpace. $\endgroup$
    – jeremy
    Commented May 31, 2010 at 9:00
2
$\begingroup$

This theory is along the same lines as the answer provided by Tom Harada. If relax the orthagonality constraint in defining each dimension, and if you visualize 3D space as a honeycomb of Rhombic Dodecahedrons, then you can represent 6 dimensions within this honeycomb. Each dimension is defined by the line running through the center of each dodec, perpendicular to a pair of opposing sides.

$\endgroup$
2
$\begingroup$

I like to think of myself going on a hike and observing my activity on a topographic map. The terrain itself is three dimensions and my location on the map is the 4th dimension. How tall I am is 5th dimension, the color of my shoes is the 6th dimension, the temperature of my location is the 7th dimension, etc.

$\endgroup$
1
$\begingroup$

You might have a look at the link below for some thoughts I wrote up a couple of years ago about the potential to "understand" high dimensional spaces by using multiple people (each of whom gets to see just 3 dimensions).

http://blogs.fluidinfo.com/terry/2008/01/23/understanding-high-dimensional-spaces/

Terry Jones

$\endgroup$
1
  • $\begingroup$ That reminds me of one way to intuit the concept of a manifold. $\endgroup$
    – Jon Awbrey
    Commented May 28, 2010 at 20:12
1
$\begingroup$

As a child, I was amazed when I read that Einstein unified space and time in a four-dimensional continuum. I had the idea that you really need to visualize 4 dimensions as you do with 3, to understand relativity. But I knew that evolution didn't wire our brain for this. So I imagined aliens having organs able to perceive 3D images in 3D, not projected on a 2D retina, and who can use a pair of such organs for stereoscopic 4D viewing...

In time, I realized that there are simpler ways. Of course it depends on the problem, but in the big majority of cases, when you are interested in a domain which involves higher-dimensional thinking, just dive in that domain and start learning what is known. Those who developed the domain had the same problems with intuition when it came about higher dimensions, so in general, the methods they developed are incremental. Each advance clarified more and more, so just follow their learning curve and build each higher-dimensional muscle at a time.

There are results in which one doesn't encounter big surprises in higher dimensions, master them first. Linear algebra is almost completely independent on the number of dimensions. Then, you can learn affine geometry. Orthogonal groups. Clifford algebras have some particularities depending on the dimension, but the main features repeat after 8 dimensions.

The most surprises appear in higher dimensional topology. But here there are also tools which work independent on the number of dimensions. For instance, many things can be understood by triangulating the topological spaces (using simplicial complexes). Also, differentiable manifolds are locally similar to vector spaces, so you can apply what you already know. Master these first.

Higher dimensions can be tricky for the same reason any generalization is: when you generalize an idea, surprises may appear in the more complex situations. Understanding first the tool which are independent on the dimensions, like those mentioned above, can help you have a solid ground under your feet, so that the leap is safer. I recommend that any result in higher dimensions to be restated as much as possible using the dimension-independent tools. If there is no particularity involved in the number of dimension, maybe it can be generalized to any dimension. If there are dimension-specific particularities, at least you isolated them. This makes understanding and verification easier.

$\endgroup$
-3
$\begingroup$

The first thing you'd want to do is to take away the continuum of space, because humans understand better discreet space. Its easier to think of space in discrete chunks, that is I divide space in units of known conventional size. Let's take the example of LCD screens in computers: the LCD is made of many pixels put on a 2-dimensional matrix. You can tell if a line on the screen is longer than another an for all purposes here it behaves like normal space, respects the same math laws and so on.

But then, each pixel that makes the screen has 3 tiny devices that make it emit light in different spectrum ranges, that is RED, GREEN, BLUE (RGB for short). Each device for a given pixel and color takes one input in the range of 0..255 to know the intensity of the light it lets out, 0 stands for no light emitted and 255 for the brightest. One pixel can be bright red and have all the other columns shut - that is it's RGB are (RED: 255, GREEN: 0, BLUE: 0). It is unessential that a pixel with RED 255, GREEN 0, BLUE 255 is actually purple.

And now the essential: you could consider each of those color values as a new dimension. Your LCD screen has now 3 new dimensions, making up for a total of 5 dimensions. But now, another contraption: what if you could stack several LCD displays on top each other (and see through any depth you wish for)? You could then "see" 6 dimensions, right?

Now, if you could imagine that such an "LCD cube" takes part of a space with pixels infinite small, infinite range for all dimensions width, height, depth and color and there you have a continuum 6-dimensional space. Again not considering that two colors make another color (red and blue make purple as stated above), you could add more color coded dimensions. I don't think you could represent these in real life or in software, but hey, this is imagination! So, given an "N" number of colors, there you have it: N-dimensional space with color coded dimensions!

If you want to know more about colors and displays the best place to start is the browser using HTML and CSS. You can make a txt file with <div style="background: rgb(255, 0, 255)"></div> as content and start experimenting with colors. Search the web for: [http://www.google.com/search?client=ubuntu&channel=fs&q=html+colors&ie=utf-8&oe=utf-8]HTML color[1] and you'll find plenty.

Another example is thermal gradient which measures "How hot it is at a given distance from a hot object?". Measuring that in many points around a hot object makes a 3D heat map. In this case temperature gradient is a fourth dimension, representing it however still uses color codes (usually dark/green, red, yellow, white for cold, hot, hotter and respectively the hottest). Thermal gradient

$\endgroup$
2
  • $\begingroup$ A) Let's try it just to see how difficult it is to repesent: we add the fourth color coded dimension PURPLE. So now we have X, Y, Z, RED, GREEN, BLUE and PURPLE. We take three points in this space as an example, keeping X, Y, Z, as 0 because everyone knows about them. First we need to know that (0, 0, 0, 1, 0, 1, 0) and (0, 0, 0, 0, 0, 0, 1) although are different points they will show as just one point because in real LCD's colors don't change independently as in our "algebraic LCD screen". $\endgroup$
    – bogdanbiv
    Commented May 28, 2010 at 14:31
  • $\begingroup$ B) How do you feel N-dimensional space? In 1D, 2D and even 3D humans compute distance natively - that is if one gives you 2 segments anywhere in sight you can see which segment is longer. It doesent take a scientist to find out the answer. With N-dimensional space that's much harder to compute even with a pencil and a paper! Without computing distance automatically in the brain, our perception of the (X, Y, Z, Red) space is crippled. There is no empiric feeling about it and we rely on Rational Process, instead of Vision, in order to see through it. Never mention XYZRGB space or higher dims. $\endgroup$
    – bogdanbiv
    Commented May 28, 2010 at 14:48
-3
$\begingroup$

i'll try somethings here (in a physical approach, if you like)

We have 3 dimensions of space,

up-down, left-right, front-back

maybe time (or more correctly duration) as a fourth dimension does not quite cut it, so lets see sth else

(note, i'm using natural analogies, not fictional as i think this is what the question is about)

  1. color, color can be a 4th dimension
  2. frequency (sim)
  3. age (sim)
  4. maybe some other property of a system or constitution, e.g number of particles, shape, configuration, size, input/output nodes and so on..

Hope the above give an idea (or more correctly an analogy)

$\endgroup$
-15
$\begingroup$

I'm no mathematician, just a lay engineer, but I stumbled across this video some time ago, maybe it will help you. http://www.boingboing.net/2009/08/18/visualizing-up-to-te.html

$\endgroup$
1
  • 12
    $\begingroup$ As people have pointed out in the comments at boingboing, this video is nonsense. $\endgroup$ Commented May 26, 2010 at 11:55

You must log in to answer this question.

Not the answer you're looking for? Browse other questions tagged .