Let a human $h(t)$ random walk on $\mathbb{Z}^2$ by taking a unit-length step at every time step $t$. A dog $d(t)$ on a leash of length $\lambda$ follows $h(t)$, also taking a unit-length step at every time step, but always retaining a Manhattan distance $|x|+|y| \le \lambda$, where $(x,y)=h(t)-d(t)$. So $d(t)$ remains inside the diamond-shaped $L_1$-ball centered on $h(t)$.
Just as in real life, it is natural to expect the dog to be closer to the
periphery of the $L_1$-ball than to its master, constantly tugging on a taut leash.
Indeed when I simulate this process, this situation obtains.
Here is an example of a 100,000-step walk, with a leash of length $\lambda=50$,
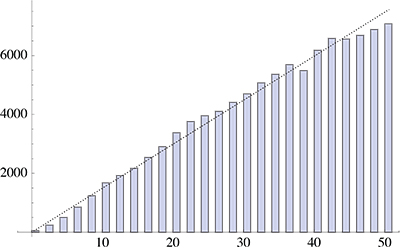
showing a histogram of the $L_1$-distance of $h(t)-d(t)$:

The growth is roughly linear in distance, but is perhaps falling off below linear.
My question is:
Is there some logic to suggest this distribution should be linear, or instead, sublinear, with respect to distance?
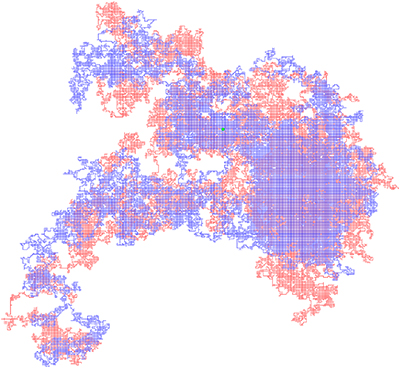
Here is the human path (blue) and the dog's wandering (red)
which the above histogram summarizes:

