added graph and some explanation
Source Link
user44143
user44143

As noted in the comments, it appears unlikely that a simple closed formula exists, but here is a way to solve the problem numerically.

By rescaling one can choose $a_0=0$ and $a_d=1$. Because the overlap depends only on $k+l$, it is sufficient to consider the case $l=0$. Also the width in the following is denoted as $k$ instead of $2\,k$. One thus has a list $A=(0,a_1,\ldots,1)$ and tries to find a spacing $p<1$ and width $ k>0$ such that a regular lattice with interval width $ k$ does not intersect $A$. For fixed $p$, the possible values of $k$ can be found by sorting the list $\left({\rm mod}(a_i,p)\right)_{i=0,\ldots,d}$ and finding the maximal circular gap $g(p)$. For all values $ k<g(p)$ a non-overlapping periodic lattice with distance $p$ and width $k$ can be found.

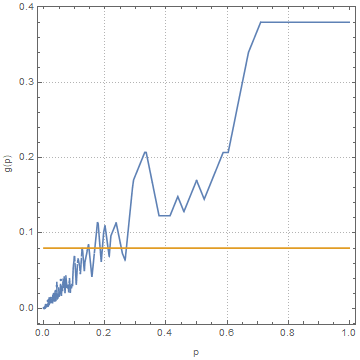
To find the possible values of $p$ for given $k$ one has to make use of the fact that $g(p)$ is continuous (piecewise linear) and calculate it on a sufficiently fine grid in the interval $p\in [k,1]$ to see if there is a value of $p$ for which $g(p)>k$. I guess that these calculations can be done quite efficiently, maybe even in time $O(d)$. The Mathematica code below implements the function $g$ and creates the example plot for the list $A=(0,0.123, 0.33, 0.71,1)$ and $k=0.08$. The allowed values of $p$ are therefore the values which are (greater than $k$ and) with $g(p)$ above the orange line.

enter image description here

Gap[x_, p_] := Module[{ll}, ll = Append[Sort[Mod[#, p] & /@ Join[{0}, x, {1}]], p]; Max[ll[[2 ;;]] - ll[[;; -2]]]]

Plot[{Gap[{0.123, 0.33, 0.71}, p], 0.08}, {p, 0, 1}, PlotTheme -> "Detailed", AspectRatio -> 1, FrameLabel -> {"p", "g(p)"}]

As noted in the comments, it appears unlikely that a simple closed formula exists, but here is a way to solve the problem numerically.

By rescaling one can choose $a_0=0$ and $a_d=1$. Because the overlap depends only on $k+l$, it is sufficient to consider the case $l=0$. Also the width in the following is denoted as $k$ instead of $2\,k$. One thus has a list $A=(0,a_1,\ldots,1)$ and tries to find a spacing $p<1$ and width $ k>0$ such that a regular lattice with interval width $ k$ does not intersect $A$. For fixed $p$, the possible values of $k$ can be found by sorting the list $\left({\rm mod}(a_i,p)\right)_{i=0,\ldots,d}$ and finding the maximal circular gap $g(p)$. For all values $ k<g(p)$ a non-overlapping periodic lattice with distance $p$ and width $k$ can be found.

To find the possible values of $p$ for given $k$ one has to make use of the fact that $g(p)$ is continuous (piecewise linear) and calculate it on a sufficiently fine grid in the interval $p\in [k,1]$ to see if there is a value of $p$ for which $g(p)>k$. I guess that these calculations can be done quite efficiently, maybe even in time $O(d)$. The Mathematica code below implements the function $g$ and creates the example plot for the list $A=(0,0.123, 0.33, 0.71,1)$.

Gap[x_, p_] := Module[{ll}, ll = Append[Sort[Mod[#, p] & /@ Join[{0}, x, {1}]], p]; Max[ll[[2 ;;]] - ll[[;; -2]]]]

Plot[{Gap[{0.123, 0.33, 0.71}, p], 0.08}, {p, 0, 1}, PlotTheme -> "Detailed", AspectRatio -> 1, FrameLabel -> {"p", "g(p)"}]

As noted in the comments, it appears unlikely that a simple closed formula exists, but here is a way to solve the problem numerically.

By rescaling one can choose $a_0=0$ and $a_d=1$. Because the overlap depends only on $k+l$, it is sufficient to consider the case $l=0$. Also the width in the following is denoted as $k$ instead of $2\,k$. One thus has a list $A=(0,a_1,\ldots,1)$ and tries to find a spacing $p<1$ and width $ k>0$ such that a regular lattice with interval width $ k$ does not intersect $A$. For fixed $p$, the possible values of $k$ can be found by sorting the list $\left({\rm mod}(a_i,p)\right)_{i=0,\ldots,d}$ and finding the maximal circular gap $g(p)$. For all values $ k<g(p)$ a non-overlapping periodic lattice with distance $p$ and width $k$ can be found.

To find the possible values of $p$ for given $k$ one has to make use of the fact that $g(p)$ is continuous (piecewise linear) and calculate it on a sufficiently fine grid in the interval $p\in [k,1]$ to see if there is a value of $p$ for which $g(p)>k$. I guess that these calculations can be done quite efficiently, maybe even in time $O(d)$. The Mathematica code below implements the function $g$ and creates the example plot for the list $A=(0,0.123, 0.33, 0.71,1)$ and $k=0.08$. The allowed values of $p$ are therefore the values which are (greater than $k$ and) with $g(p)$ above the orange line.

enter image description here

Gap[x_, p_] := Module[{ll}, ll = Append[Sort[Mod[#, p] & /@ Join[{0}, x, {1}]], p]; Max[ll[[2 ;;]] - ll[[;; -2]]]]

Plot[{Gap[{0.123, 0.33, 0.71}, p], 0.08}, {p, 0, 1}, PlotTheme -> "Detailed", AspectRatio -> 1, FrameLabel -> {"p", "g(p)"}]

Source Link
Karl Fabian
  • 1.7k
  • 10
  • 15

As noted in the comments, it appears unlikely that a simple closed formula exists, but here is a way to solve the problem numerically.

By rescaling one can choose $a_0=0$ and $a_d=1$. Because the overlap depends only on $k+l$, it is sufficient to consider the case $l=0$. Also the width in the following is denoted as $k$ instead of $2\,k$. One thus has a list $A=(0,a_1,\ldots,1)$ and tries to find a spacing $p<1$ and width $ k>0$ such that a regular lattice with interval width $ k$ does not intersect $A$. For fixed $p$, the possible values of $k$ can be found by sorting the list $\left({\rm mod}(a_i,p)\right)_{i=0,\ldots,d}$ and finding the maximal circular gap $g(p)$. For all values $ k<g(p)$ a non-overlapping periodic lattice with distance $p$ and width $k$ can be found.

To find the possible values of $p$ for given $k$ one has to make use of the fact that $g(p)$ is continuous (piecewise linear) and calculate it on a sufficiently fine grid in the interval $p\in [k,1]$ to see if there is a value of $p$ for which $g(p)>k$. I guess that these calculations can be done quite efficiently, maybe even in time $O(d)$. The Mathematica code below implements the function $g$ and creates the example plot for the list $A=(0,0.123, 0.33, 0.71,1)$.

Gap[x_, p_] := Module[{ll}, ll = Append[Sort[Mod[#, p] & /@ Join[{0}, x, {1}]], p]; Max[ll[[2 ;;]] - ll[[;; -2]]]]

Plot[{Gap[{0.123, 0.33, 0.71}, p], 0.08}, {p, 0, 1}, PlotTheme -> "Detailed", AspectRatio -> 1, FrameLabel -> {"p", "g(p)"}]