added 12 characters in body
Source Link

A few more interesting plots, including a spectacular one that I call The Eye of The Zeta Function (the last one on this post).

The series for $\phi_1$ and $\phi_2$ (see Appendix in my original question) converge very slowly and in a chaotic way depending on $\sigma$ and $t$. A better solution is to use the Riemann-Siegel formula.

Slow, chaotic convergence of the series

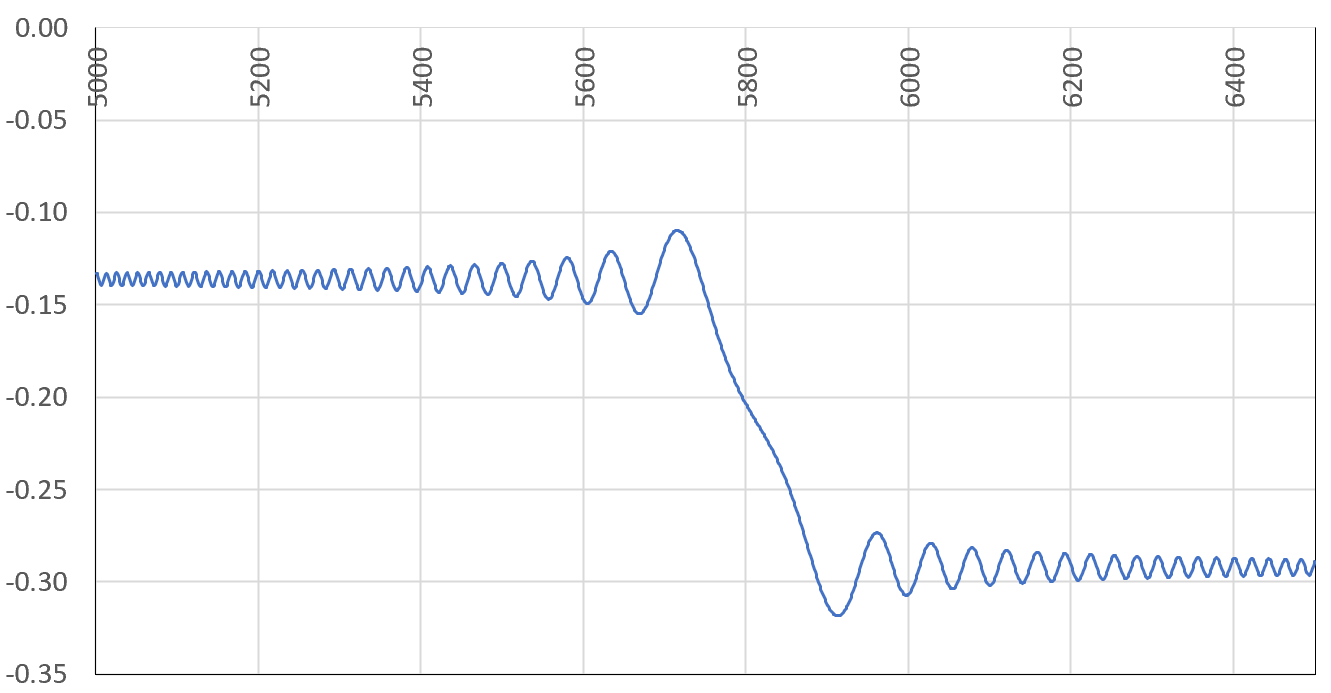
If for some large $n$ in the series, the quantity $t\log(n+1) - t\log n \approx t/n$ is close to an odd multiple of $\pi$, then around that $n$, a lot of terms in the series will have the same sign and similar value (as opposed to the regular alternating behavior), and if $n$ is not large enough, a sum that seems to have converged before $n$ will suddenly experience a huge shift. This is illustrated below.

enter image description here

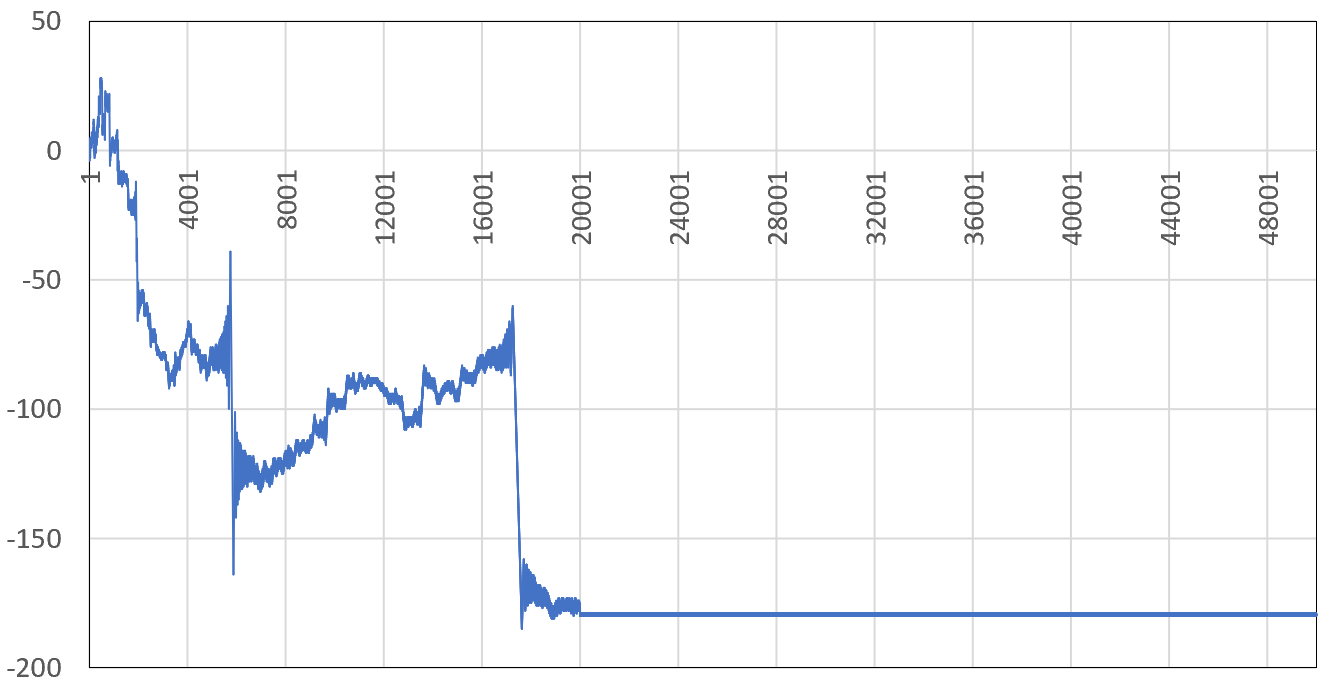
In the above figure, the sum for $\phi_2$ with $\sigma=0.75$ and $t=18265.2$ after seemingly converging to around $-0.135$ using the first 5000 terms, experiences a massive drop between $n=5760$ and $5860$ before stabilizing at around $-0.292$ (the correct value confirmed by Mathematica). The next chart shows the cumulative sum of the term signs, for consecutive terms of the series up to $n=50000$. A huge drop or increase means many successive terms having the same sign around the $n$ in question (the X-axis represents $n$), explaining the mechanism at play in the first chart.

enter image description here

Note that when $n$ is large enough, the series (at least in this example, around $n=20,000$) eventually becomes almost perfectly alternating: the blue curve in the previous plot becomes an almost flat horizontal line.

The eye of the Zeta function

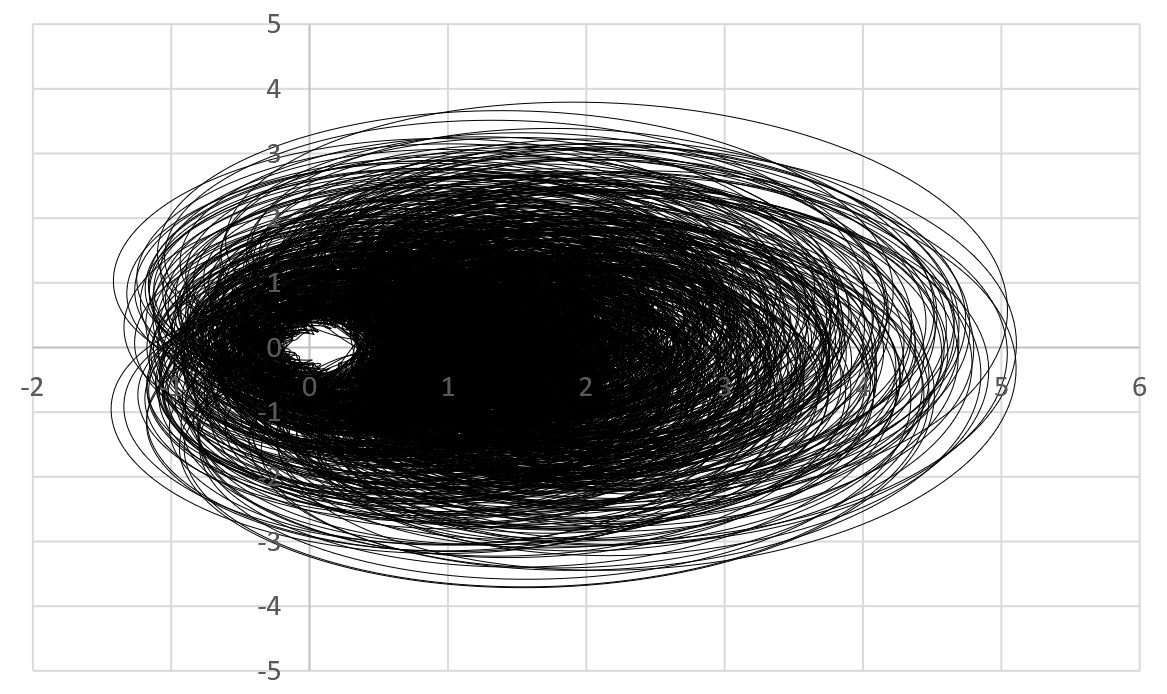
Below is the scaled orbit of the Zeta function for $\sigma=0.75$ and $0<t<3000$, featuring $300,000$ points $(X(t),Y(t))$, with $X(t)=\phi_1(\sigma,t)$, $Y(t)=\phi_2(\sigma,t)$, and using increments of $0.01$ for $t$. What you see below is just one slice corresponding to $\sigma=0.75$. The whole orbit (if you allow $\sigma$ to vary in $]\frac{1}{2},1[$) would densely cover a 3-D volume in space.

There is a hole (the "eye") around $(0,0)$ suggesting that $\zeta(\sigma+it)$ has no root if $\sigma=0.75$. It looks like there is an absolute positive constant $\epsilon_\sigma$ (not depending on $t$) such that $X^2(t)+Y^2(t) > \epsilon_\sigma$$X^2(t)+Y^2(t) \geq \epsilon_\sigma$ for all $t$'s if $\sigma \neq \frac{1}{2}$. The million-dollar question is this: Do we have $\epsilon_\sigma \neq 0$? Of course, for the limiting case $\sigma=\frac{1}{2}$, we have $\epsilon_\sigma = 0$ since $\zeta$ has at least one root (indeed infinitely many) on the critical line.

Getting this plot right is not easy, since the series for $\phi_1,\phi_2$ converge in a chaotic way and require convergence boosting techniques (see here). Also using increments of $0.01$ is OK for small values of $t$, but as $t$ becomes larger, the oscillations in $\phi_1,\phi_2$ get exacerbated, requiring smaller and smaller increments to get a good coverage of the orbit, and to avoid missing a potential root.

enter image description here

My next step is to randomize $\phi_1,\phi_2$, possibly replacing $\cos(\gamma + t\log n)$ by $Z_n \cdot \cos(\gamma + t\log n)$, where $Z_1,Z_2\dots$ are i.i.d. Bernoulli-like random variables. I've already spent many hours on that, to no avail so far. Along similar lines, see this paper discussing the complete Riemann Zeta distribution.

A few more interesting plots, including a spectacular one that I call The Eye of The Zeta Function (the last one on this post).

The series for $\phi_1$ and $\phi_2$ (see Appendix in my original question) converge very slowly and in a chaotic way depending on $\sigma$ and $t$. A better solution is to use the Riemann-Siegel formula.

Slow, chaotic convergence of the series

If for some large $n$ in the series, the quantity $t\log(n+1) - t\log n \approx t/n$ is close to an odd multiple of $\pi$, then around that $n$, a lot of terms in the series will have the same sign and similar value (as opposed to the regular alternating behavior), and if $n$ is not large enough, a sum that seems to have converged before $n$ will suddenly experience a huge shift. This is illustrated below.

enter image description here

In the above figure, the sum for $\phi_2$ with $\sigma=0.75$ and $t=18265.2$ after seemingly converging to around $-0.135$ using the first 5000 terms, experiences a massive drop between $n=5760$ and $5860$ before stabilizing at around $-0.292$ (the correct value confirmed by Mathematica). The next chart shows the cumulative sum of the term signs, for consecutive terms of the series up to $n=50000$. A huge drop or increase means many successive terms having the same sign around the $n$ in question (the X-axis represents $n$), explaining the mechanism at play in the first chart.

enter image description here

Note that when $n$ is large enough, the series (at least in this example, around $n=20,000$) eventually becomes almost perfectly alternating: the blue curve in the previous plot becomes an almost flat horizontal line.

The eye of the Zeta function

Below is the scaled orbit of the Zeta function for $\sigma=0.75$ and $0<t<3000$, featuring $300,000$ points $(X(t),Y(t))$, with $X(t)=\phi_1(\sigma,t)$, $Y(t)=\phi_2(\sigma,t)$, and using increments of $0.01$ for $t$. What you see below is just one slice corresponding to $\sigma=0.75$. The whole orbit (if you allow $\sigma$ to vary in $]\frac{1}{2},1[$) would densely cover a 3-D volume in space.

There is a hole (the "eye") around $(0,0)$ suggesting that $\zeta(\sigma+it)$ has no root if $\sigma=0.75$. It looks like there is an absolute constant $\epsilon_\sigma$ (not depending on $t$) such that $X^2(t)+Y^2(t) > \epsilon_\sigma$ for all $t$'s if $\sigma \neq \frac{1}{2}$. The million-dollar question is this: Do we have $\epsilon_\sigma \neq 0$? Of course, for the limiting case $\sigma=\frac{1}{2}$, we have $\epsilon_\sigma = 0$ since $\zeta$ has at least one root (indeed infinitely many) on the critical line.

Getting this plot right is not easy, since the series for $\phi_1,\phi_2$ converge in a chaotic way and require convergence boosting techniques (see here). Also using increments of $0.01$ is OK for small values of $t$, but as $t$ becomes larger, the oscillations in $\phi_1,\phi_2$ get exacerbated, requiring smaller and smaller increments to get a good coverage of the orbit, and to avoid missing a potential root.

enter image description here

My next step is to randomize $\phi_1,\phi_2$, possibly replacing $\cos(\gamma + t\log n)$ by $Z_n \cdot \cos(\gamma + t\log n)$, where $Z_1,Z_2\dots$ are i.i.d. Bernoulli-like random variables. I've already spent many hours on that, to no avail so far. Along similar lines, see this paper discussing the complete Riemann Zeta distribution.
A few more interesting plots, including a spectacular one that I call The Eye of The Zeta Function (the last one on this post).

The series for $\phi_1$ and $\phi_2$ (see Appendix in my original question) converge very slowly and in a chaotic way depending on $\sigma$ and $t$. A better solution is to use the Riemann-Siegel formula.

Slow, chaotic convergence of the series

If for some large $n$ in the series, the quantity $t\log(n+1) - t\log n \approx t/n$ is close to an odd multiple of $\pi$, then around that $n$, a lot of terms in the series will have the same sign and similar value (as opposed to the regular alternating behavior), and if $n$ is not large enough, a sum that seems to have converged before $n$ will suddenly experience a huge shift. This is illustrated below.

enter image description here

In the above figure, the sum for $\phi_2$ with $\sigma=0.75$ and $t=18265.2$ after seemingly converging to around $-0.135$ using the first 5000 terms, experiences a massive drop between $n=5760$ and $5860$ before stabilizing at around $-0.292$ (the correct value confirmed by Mathematica). The next chart shows the cumulative sum of the term signs, for consecutive terms of the series up to $n=50000$. A huge drop or increase means many successive terms having the same sign around the $n$ in question (the X-axis represents $n$), explaining the mechanism at play in the first chart.

enter image description here

Note that when $n$ is large enough, the series (at least in this example, around $n=20,000$) eventually becomes almost perfectly alternating: the blue curve in the previous plot becomes an almost flat horizontal line.

The eye of the Zeta function

Below is the scaled orbit of the Zeta function for $\sigma=0.75$ and $0<t<3000$, featuring $300,000$ points $(X(t),Y(t))$, with $X(t)=\phi_1(\sigma,t)$, $Y(t)=\phi_2(\sigma,t)$, and using increments of $0.01$ for $t$. What you see below is just one slice corresponding to $\sigma=0.75$. The whole orbit (if you allow $\sigma$ to vary in $]\frac{1}{2},1[$) would densely cover a 3-D volume in space.

There is a hole (the "eye") around $(0,0)$ suggesting that $\zeta(\sigma+it)$ has no root if $\sigma=0.75$. It looks like there is an absolute positive constant $\epsilon_\sigma$ (not depending on $t$) such that $X^2(t)+Y^2(t) \geq \epsilon_\sigma$ for all $t$'s if $\sigma \neq \frac{1}{2}$. The million-dollar question is this: Do we have $\epsilon_\sigma \neq 0$? Of course, for the limiting case $\sigma=\frac{1}{2}$, we have $\epsilon_\sigma = 0$ since $\zeta$ has at least one root (indeed infinitely many) on the critical line.

Getting this plot right is not easy, since the series for $\phi_1,\phi_2$ converge in a chaotic way and require convergence boosting techniques (see here). Also using increments of $0.01$ is OK for small values of $t$, but as $t$ becomes larger, the oscillations in $\phi_1,\phi_2$ get exacerbated, requiring smaller and smaller increments to get a good coverage of the orbit, and to avoid missing a potential root.

enter image description here

My next step is to randomize $\phi_1,\phi_2$, possibly replacing $\cos(\gamma + t\log n)$ by $Z_n \cdot \cos(\gamma + t\log n)$, where $Z_1,Z_2\dots$ are i.i.d. Bernoulli-like random variables. I've already spent many hours on that, to no avail so far. Along similar lines, see this paper discussing the complete Riemann Zeta distribution.
deleted 1 character in body
Source Link

A few more interesting plots, including a spectacular one that I call TheyThe Eye of The Zeta Function (the last one on this post).

The series for $\phi_1$ and $\phi_2$ (see Appendix in my original question) converge very slowly and in a chaotic way depending on $\sigma$ and $t$. A better solution is to use the Riemann-Siegel formula.

Slow, chaotic convergence of the series

If for some large $n$ in the series, the quantity $t\log(n+1) - t\log n \approx t/n$ is close to an odd multiple of $\pi$, then around that $n$, a lot of terms in the series will have the same sign and similar value (as opposed to the regular alternating behavior), and if $n$ is not large enough, a sum that seems to have converged before $n$ will suddenly experience a huge shift. This is illustrated below.

enter image description here

In the above figure, the sum for $\phi_2$ with $\sigma=0.75$ and $t=18265.2$ after seemingly converging to around $-0.135$ using the first 5000 terms, experiences a massive drop between $n=5760$ and $5860$ before stabilizing at around $-0.292$ (the correct value confirmed by Mathematica). The next chart shows the cumulative sum of the term signs, for consecutive terms of the series up to $n=50000$. A huge drop or increase means many successive terms having the same sign around the $n$ in question (the X-axis represents $n$), explaining the mechanism at play in the first chart.

enter image description here

Note that when $n$ is large enough, the series (at least in this example, around $n=20,000$) eventually becomes almost perfectly alternating: the blue curve in the previous plot becomes an almost flat horizontal line.

The eye of the Zeta function

Below is the scaled orbit of the Zeta function for $\sigma=0.75$ and $0<t<3000$, featuring $300,000$ points $(X(t),Y(t))$, with $X(t)=\phi_1(\sigma,t)$, $Y(t)=\phi_2(\sigma,t)$, and using increments of $0.01$ for $t$. What you see below is just one slice corresponding to $\sigma=0.75$. The whole orbit (if you allow $\sigma$ to vary in $]\frac{1}{2},1[$) would densely cover a 3-D volume in space.

There is a hole (the "eye") around $(0,0)$ suggesting that $\zeta(\sigma+it)$ has no root if $\sigma=0.75$. It looks like there is an absolute constant $\epsilon_\sigma$ (not depending on $t$) such that $X^2(t)+Y^2(t) > \epsilon_\sigma$ for all $t$'s if $\sigma \neq \frac{1}{2}$. The million-dollar question is this: Do we have $\epsilon_\sigma \neq 0$? Of course, for the limiting case $\sigma=\frac{1}{2}$, we have $\epsilon_\sigma = 0$ since $\zeta$ has at least one root (indeed infinitely many) on the critical line.

Getting this plot right is not easy, since the series for $\phi_1,\phi_2$ converge in a chaotic way and require convergence boosting techniques (see here). Also using increments of $0.01$ is OK for small values of $t$, but as $t$ becomes larger, the oscillations in $\phi_1,\phi_2$ get exacerbated, requiring smaller and smaller increments to get a good coverage of the orbit, and to avoid missing a potential root.

enter image description here

My next step is to randomize $\phi_1,\phi_2$, possibly replacing $\cos(\gamma + t\log n)$ by $Z_n \cdot \cos(\gamma + t\log n)$, where $Z_1,Z_2\dots$ are i.i.d. Bernoulli-like random variables. I've already spent many hours on that, to no avail so far. Along similar lines, see this paper discussing the complete Riemann Zeta distribution.

A few more interesting plots, including a spectacular one that I call They Eye of The Zeta Function (the last one on this post).

The series for $\phi_1$ and $\phi_2$ (see Appendix in my original question) converge very slowly and in a chaotic way depending on $\sigma$ and $t$. A better solution is to use the Riemann-Siegel formula.

Slow, chaotic convergence of the series

If for some large $n$ in the series, the quantity $t\log(n+1) - t\log n \approx t/n$ is close to an odd multiple of $\pi$, then around that $n$, a lot of terms in the series will have the same sign and similar value (as opposed to the regular alternating behavior), and if $n$ is not large enough, a sum that seems to have converged before $n$ will suddenly experience a huge shift. This is illustrated below.

enter image description here

In the above figure, the sum for $\phi_2$ with $\sigma=0.75$ and $t=18265.2$ after seemingly converging to around $-0.135$ using the first 5000 terms, experiences a massive drop between $n=5760$ and $5860$ before stabilizing at around $-0.292$ (the correct value confirmed by Mathematica). The next chart shows the cumulative sum of the term signs, for consecutive terms of the series up to $n=50000$. A huge drop or increase means many successive terms having the same sign around the $n$ in question (the X-axis represents $n$), explaining the mechanism at play in the first chart.

enter image description here

Note that when $n$ is large enough, the series (at least in this example, around $n=20,000$) eventually becomes almost perfectly alternating: the blue curve in the previous plot becomes an almost flat horizontal line.

The eye of the Zeta function

Below is the scaled orbit of the Zeta function for $\sigma=0.75$ and $0<t<3000$, featuring $300,000$ points $(X(t),Y(t))$, with $X(t)=\phi_1(\sigma,t)$, $Y(t)=\phi_2(\sigma,t)$, and using increments of $0.01$ for $t$. What you see below is just one slice corresponding to $\sigma=0.75$. The whole orbit (if you allow $\sigma$ to vary in $]\frac{1}{2},1[$) would densely cover a 3-D volume in space.

There is a hole (the "eye") around $(0,0)$ suggesting that $\zeta(\sigma+it)$ has no root if $\sigma=0.75$. It looks like there is an absolute constant $\epsilon_\sigma$ (not depending on $t$) such that $X^2(t)+Y^2(t) > \epsilon_\sigma$ for all $t$'s if $\sigma \neq \frac{1}{2}$. The million-dollar question is this: Do we have $\epsilon_\sigma \neq 0$? Of course, for the limiting case $\sigma=\frac{1}{2}$, we have $\epsilon_\sigma = 0$ since $\zeta$ has at least one root (indeed infinitely many) on the critical line.

Getting this plot right is not easy, since the series for $\phi_1,\phi_2$ converge in a chaotic way and require convergence boosting techniques (see here). Also using increments of $0.01$ is OK for small values of $t$, but as $t$ becomes larger, the oscillations in $\phi_1,\phi_2$ get exacerbated, requiring smaller and smaller increments to get a good coverage of the orbit, and to avoid missing a potential root.

enter image description here

My next step is to randomize $\phi_1,\phi_2$, possibly replacing $\cos(\gamma + t\log n)$ by $Z_n \cdot \cos(\gamma + t\log n)$, where $Z_1,Z_2\dots$ are i.i.d. Bernoulli-like random variables. I've already spent many hours on that, to no avail so far. Along similar lines, see this paper discussing the complete Riemann Zeta distribution.

A few more interesting plots, including a spectacular one that I call The Eye of The Zeta Function (the last one on this post).

The series for $\phi_1$ and $\phi_2$ (see Appendix in my original question) converge very slowly and in a chaotic way depending on $\sigma$ and $t$. A better solution is to use the Riemann-Siegel formula.

Slow, chaotic convergence of the series

If for some large $n$ in the series, the quantity $t\log(n+1) - t\log n \approx t/n$ is close to an odd multiple of $\pi$, then around that $n$, a lot of terms in the series will have the same sign and similar value (as opposed to the regular alternating behavior), and if $n$ is not large enough, a sum that seems to have converged before $n$ will suddenly experience a huge shift. This is illustrated below.

enter image description here

In the above figure, the sum for $\phi_2$ with $\sigma=0.75$ and $t=18265.2$ after seemingly converging to around $-0.135$ using the first 5000 terms, experiences a massive drop between $n=5760$ and $5860$ before stabilizing at around $-0.292$ (the correct value confirmed by Mathematica). The next chart shows the cumulative sum of the term signs, for consecutive terms of the series up to $n=50000$. A huge drop or increase means many successive terms having the same sign around the $n$ in question (the X-axis represents $n$), explaining the mechanism at play in the first chart.

enter image description here

Note that when $n$ is large enough, the series (at least in this example, around $n=20,000$) eventually becomes almost perfectly alternating: the blue curve in the previous plot becomes an almost flat horizontal line.

The eye of the Zeta function

Below is the scaled orbit of the Zeta function for $\sigma=0.75$ and $0<t<3000$, featuring $300,000$ points $(X(t),Y(t))$, with $X(t)=\phi_1(\sigma,t)$, $Y(t)=\phi_2(\sigma,t)$, and using increments of $0.01$ for $t$. What you see below is just one slice corresponding to $\sigma=0.75$. The whole orbit (if you allow $\sigma$ to vary in $]\frac{1}{2},1[$) would densely cover a 3-D volume in space.

There is a hole (the "eye") around $(0,0)$ suggesting that $\zeta(\sigma+it)$ has no root if $\sigma=0.75$. It looks like there is an absolute constant $\epsilon_\sigma$ (not depending on $t$) such that $X^2(t)+Y^2(t) > \epsilon_\sigma$ for all $t$'s if $\sigma \neq \frac{1}{2}$. The million-dollar question is this: Do we have $\epsilon_\sigma \neq 0$? Of course, for the limiting case $\sigma=\frac{1}{2}$, we have $\epsilon_\sigma = 0$ since $\zeta$ has at least one root (indeed infinitely many) on the critical line.

Getting this plot right is not easy, since the series for $\phi_1,\phi_2$ converge in a chaotic way and require convergence boosting techniques (see here). Also using increments of $0.01$ is OK for small values of $t$, but as $t$ becomes larger, the oscillations in $\phi_1,\phi_2$ get exacerbated, requiring smaller and smaller increments to get a good coverage of the orbit, and to avoid missing a potential root.

enter image description here

My next step is to randomize $\phi_1,\phi_2$, possibly replacing $\cos(\gamma + t\log n)$ by $Z_n \cdot \cos(\gamma + t\log n)$, where $Z_1,Z_2\dots$ are i.i.d. Bernoulli-like random variables. I've already spent many hours on that, to no avail so far. Along similar lines, see this paper discussing the complete Riemann Zeta distribution.

deleted 1 character in body
Source Link

A few more interesting plots, including a spectacular one that I call They Eye of The Zeta Function (the last one on this post).

The series for $\phi_1$ and $\phi_2$ (see Appendix in my original question) converge very slowly and in a chaotic way depending on $\sigma$ and $t$. A better solution is to use the Riemann-Siegel formula.

Slow, chaotic convergence of the series

If for some large $n$ in the series, the quantity $t\log(n+1) - t\log n \approx t/n$ is close to an odd multiple of $\pi$, then around that $n$, a lot of terms in the series will have the same sign and similar value (as opposed to the regular alternating behavior), and if $n$ is not large enough, a sum that seems to have converged before $n$ will suddenly experience a huge shift. This is illustrated below.

enter image description here

In the above figure, the sum for $\phi_2$ with $\sigma=0.75$ and $t=18265.2$ after seemingly converging to around $-0.135$ using the first 5000 terms, experiences a massive drop between $n=5760$ and $5860$ before stabilizing at around $-0.292$ (the correct value confirmed by Mathematica). The next chart shows the cumulative sum of the term signs, for consecutive terms of the series up to $n=50000$. A huge drop or increase means many successive terms having the same sign around the $n$ in question (the X-axis represents $n$), explaining the mechanism at play in the first chart.

enter image description here

Note that when $n$ is large enough, the series (at least in this example, around $n=20,000$) eventually becomes almost perfectly alternating: the blue curve in the previous plot becomes an almost flat horizontal line.

The eye of the Zeta function

Below is the scaled orbit of the Zeta function for $\sigma=0.75$ and $0<t<3000$, featuring $300,000$ points $(X(t),Y(t))$, with $X(t)=\phi_1(\sigma,t)$, $Y(t)=\phi_2(\sigma,t)$, and using increments of $0.01$ for $t$. What you see below is just one slice corresponding to $\sigma=0.75$. The whole orbit (if you allow $\sigma$ to vary in $]\frac{1}{2},1[$) would densely cover a 3-D volume in space.

There is a wholehole (the "eye") around $(0,0)$ suggesting that $\zeta(\sigma+it)$ has no root if $\sigma=0.75$. It looks like there is an absolute constant $\epsilon_\sigma$ (not depending on $t$) such that $X^2(t)+Y^2(t) > \epsilon_\sigma$ for all $t$'s if $\sigma \neq \frac{1}{2}$. The million-dollar question is this: Do we have $\epsilon_\sigma \neq 0$? Of course, for the limiting case $\sigma=\frac{1}{2}$, we have $\epsilon_\sigma = 0$ since $\zeta$ has at least one root (indeed infinitely many) on the critical line.

Getting this plot right is not easy, since the series for $\phi_1,\phi_2$ converge in a chaotic way and require convergence boosting techniques (see here). Also using increments of $0.01$ is OK for small values of $t$, but as $t$ becomes larger, the oscillations in $\phi_1,\phi_2$ get exacerbated, requiring smaller and smaller increments to get a good coverage of the orbit, and to avoid missing a potential root.

enter image description here

My next step is to randomize $\phi_1,\phi_2$, possibly replacing $\cos(\gamma + t\log n)$ by $Z_n \cdot \cos(\gamma + t\log n)$, where $Z_1,Z_2\dots$ are i.i.d. Bernoulli-like random variables. I've already spent many hours on that, to no avail so far. Along similar lines, see this paper discussing the complete Riemann Zeta distribution.

A few more interesting plots, including a spectacular one that I call They Eye of The Zeta Function (the last one on this post).

The series for $\phi_1$ and $\phi_2$ (see Appendix in my original question) converge very slowly and in a chaotic way depending on $\sigma$ and $t$. A better solution is to use the Riemann-Siegel formula.

Slow, chaotic convergence of the series

If for some large $n$ in the series, the quantity $t\log(n+1) - t\log n \approx t/n$ is close to an odd multiple of $\pi$, then around that $n$, a lot of terms in the series will have the same sign and similar value (as opposed to the regular alternating behavior), and if $n$ is not large enough, a sum that seems to have converged before $n$ will suddenly experience a huge shift. This is illustrated below.

enter image description here

In the above figure, the sum for $\phi_2$ with $\sigma=0.75$ and $t=18265.2$ after seemingly converging to around $-0.135$ using the first 5000 terms, experiences a massive drop between $n=5760$ and $5860$ before stabilizing at around $-0.292$ (the correct value confirmed by Mathematica). The next chart shows the cumulative sum of the term signs, for consecutive terms of the series up to $n=50000$. A huge drop or increase means many successive terms having the same sign around the $n$ in question (the X-axis represents $n$), explaining the mechanism at play in the first chart.

enter image description here

Note that when $n$ is large enough, the series (at least in this example, around $n=20,000$) eventually becomes almost perfectly alternating: the blue curve in the previous plot becomes an almost flat horizontal line.

The eye of the Zeta function

Below is the scaled orbit of the Zeta function for $\sigma=0.75$ and $0<t<3000$, featuring $300,000$ points $(X(t),Y(t))$, with $X(t)=\phi_1(\sigma,t)$, $Y(t)=\phi_2(\sigma,t)$, and using increments of $0.01$ for $t$. What you see below is just one slice corresponding to $\sigma=0.75$. The whole orbit (if you allow $\sigma$ to vary in $]\frac{1}{2},1[$) would densely cover a 3-D volume in space.

There is a whole (the "eye") around $(0,0)$ suggesting that $\zeta(\sigma+it)$ has no root if $\sigma=0.75$. It looks like there is an absolute constant $\epsilon_\sigma$ (not depending on $t$) such that $X^2(t)+Y^2(t) > \epsilon_\sigma$ for all $t$'s if $\sigma \neq \frac{1}{2}$. The million-dollar question is this: Do we have $\epsilon_\sigma \neq 0$? Of course, for the limiting case $\sigma=\frac{1}{2}$, we have $\epsilon_\sigma = 0$ since $\zeta$ has at least one root (indeed infinitely many) on the critical line.

Getting this plot right is not easy, since the series for $\phi_1,\phi_2$ converge in a chaotic way and require convergence boosting techniques (see here). Also using increments of $0.01$ is OK for small values of $t$, but as $t$ becomes larger, the oscillations in $\phi_1,\phi_2$ get exacerbated, requiring smaller and smaller increments to get a good coverage of the orbit, and to avoid missing a potential root.

enter image description here

My next step is to randomize $\phi_1,\phi_2$, possibly replacing $\cos(\gamma + t\log n)$ by $Z_n \cdot \cos(\gamma + t\log n)$, where $Z_1,Z_2\dots$ are i.i.d. Bernoulli-like random variables. I've already spent many hours on that, to no avail so far. Along similar lines, see this paper discussing the complete Riemann Zeta distribution.

A few more interesting plots, including a spectacular one that I call They Eye of The Zeta Function (the last one on this post).

The series for $\phi_1$ and $\phi_2$ (see Appendix in my original question) converge very slowly and in a chaotic way depending on $\sigma$ and $t$. A better solution is to use the Riemann-Siegel formula.

Slow, chaotic convergence of the series

If for some large $n$ in the series, the quantity $t\log(n+1) - t\log n \approx t/n$ is close to an odd multiple of $\pi$, then around that $n$, a lot of terms in the series will have the same sign and similar value (as opposed to the regular alternating behavior), and if $n$ is not large enough, a sum that seems to have converged before $n$ will suddenly experience a huge shift. This is illustrated below.

enter image description here

In the above figure, the sum for $\phi_2$ with $\sigma=0.75$ and $t=18265.2$ after seemingly converging to around $-0.135$ using the first 5000 terms, experiences a massive drop between $n=5760$ and $5860$ before stabilizing at around $-0.292$ (the correct value confirmed by Mathematica). The next chart shows the cumulative sum of the term signs, for consecutive terms of the series up to $n=50000$. A huge drop or increase means many successive terms having the same sign around the $n$ in question (the X-axis represents $n$), explaining the mechanism at play in the first chart.

enter image description here

Note that when $n$ is large enough, the series (at least in this example, around $n=20,000$) eventually becomes almost perfectly alternating: the blue curve in the previous plot becomes an almost flat horizontal line.

The eye of the Zeta function

Below is the scaled orbit of the Zeta function for $\sigma=0.75$ and $0<t<3000$, featuring $300,000$ points $(X(t),Y(t))$, with $X(t)=\phi_1(\sigma,t)$, $Y(t)=\phi_2(\sigma,t)$, and using increments of $0.01$ for $t$. What you see below is just one slice corresponding to $\sigma=0.75$. The whole orbit (if you allow $\sigma$ to vary in $]\frac{1}{2},1[$) would densely cover a 3-D volume in space.

There is a hole (the "eye") around $(0,0)$ suggesting that $\zeta(\sigma+it)$ has no root if $\sigma=0.75$. It looks like there is an absolute constant $\epsilon_\sigma$ (not depending on $t$) such that $X^2(t)+Y^2(t) > \epsilon_\sigma$ for all $t$'s if $\sigma \neq \frac{1}{2}$. The million-dollar question is this: Do we have $\epsilon_\sigma \neq 0$? Of course, for the limiting case $\sigma=\frac{1}{2}$, we have $\epsilon_\sigma = 0$ since $\zeta$ has at least one root (indeed infinitely many) on the critical line.

Getting this plot right is not easy, since the series for $\phi_1,\phi_2$ converge in a chaotic way and require convergence boosting techniques (see here). Also using increments of $0.01$ is OK for small values of $t$, but as $t$ becomes larger, the oscillations in $\phi_1,\phi_2$ get exacerbated, requiring smaller and smaller increments to get a good coverage of the orbit, and to avoid missing a potential root.

enter image description here

My next step is to randomize $\phi_1,\phi_2$, possibly replacing $\cos(\gamma + t\log n)$ by $Z_n \cdot \cos(\gamma + t\log n)$, where $Z_1,Z_2\dots$ are i.i.d. Bernoulli-like random variables. I've already spent many hours on that, to no avail so far. Along similar lines, see this paper discussing the complete Riemann Zeta distribution.

added 95 characters in body
Source Link
Loading
Source Link
Loading