added 4 characters in body
Source Link
Denis Serre
  • 52.3k
  • 10
  • 146
  • 300

Rubik's cube and its generalizations attracts certain attention of mathematical community. It is somehow "noteworthy" that it has been proved that diameter of the Rubik's cube group is 20, i.e. cubik can be turned into initial position at worst at 20 moves, it. It rises certain interesting questions e.g. MO139469.

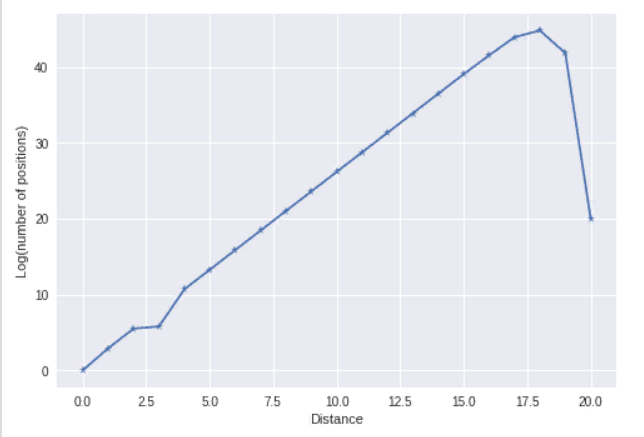
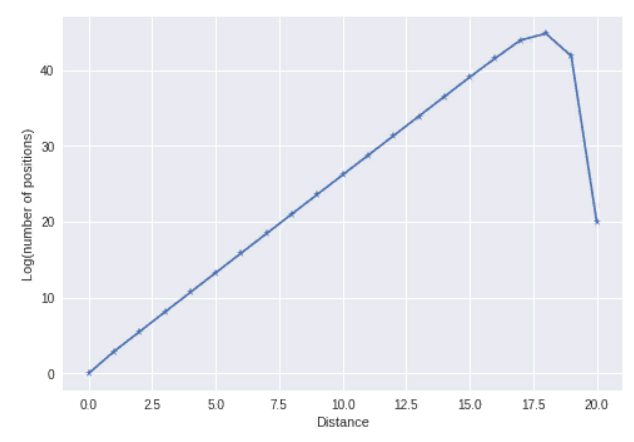
It is notNot only the diameter has been calculated, but the position count for all distances presented has been too. If one plots it at logarithmic scale one sees linear dependence almost everywhere:

Remarks: What seems puzzling for me, that exponential growth corresponds to (for example) for free group (obviously number of words of length n in k-letter alphabet is k^n), but for groups+generators which are similar to abelian groups the growth should be similar to normal distribution (a version of central limit theorem) - for example for $(Z/2Z)^n$ it corresponds to the setup of the most classical central limit theorem, which can be visualized by the Galton board (Bean machine). Similar results has been extented to permutation groups and metrics of them see MO320497. So it is somehow strange for me that Rubik's group+generators looks like free group, rather than abelian.

Datum (from http://www.cube20.org) + PyhonPython code:

Rubik's cube and its generalizations attracts certain attention of mathematical community. It is somehow "noteworthy" that it has been proved that diameter of the Rubik's cube group is 20, i.e. cubik can be turned into initial position at worst at 20 moves, it rises certain interesting questions e.g. MO139469.

It is not only the diameter has been calculated, but the position count for all distances presented. If one plots it at logarithmic scale one sees linear dependence almost everywhere:

Remarks: What seems puzzling for me, that exponential growth corresponds to (for example) for free group (obviously number of words of length n in k-letter alphabet is k^n), but for groups+generators which are similar to abelian groups the growth should be similar to normal distribution (a version of central limit theorem) - for example for $(Z/2Z)^n$ it corresponds to the setup of the most classical central limit theorem, which can be visualized by the Galton board (Bean machine). Similar results has been extented to permutation groups and metrics of them see MO320497. So it is somehow strange for me that Rubik's group+generators looks like free group, rather than abelian.

Datum (from http://www.cube20.org) + Pyhon code:

Rubik's cube and its generalizations attracts certain attention of mathematical community. It is somehow "noteworthy" that it has been proved that diameter of the Rubik's cube group is 20, i.e. cubik can be turned into initial position at worst at 20 moves. It rises certain interesting questions e.g. MO139469.

Not only the diameter has been calculated, but the position count for all distances presented has been too. If one plots it at logarithmic scale one sees linear dependence almost everywhere:

Remarks: What seems puzzling for me, that exponential growth corresponds to (for example) free group (obviously number of words of length n in k-letter alphabet is k^n), but for groups+generators which are similar to abelian groups the growth should be similar to normal distribution (a version of central limit theorem) - for example for $(Z/2Z)^n$ it corresponds to the setup of the most classical central limit theorem, which can be visualized by the Galton board (Bean machine). Similar results has been extented to permutation groups and metrics of them see MO320497. So it is somehow strange for me that Rubik's group+generators looks like free group, rather than abelian.

Datum (from http://www.cube20.org) + Python code:

deleted 41 characters in body
Source Link
Alexander Chervov
  • 24.9k
  • 20
  • 102
  • 209

Log(number of positions) Log(number of positions)

# Distance      Count of Positions  
datum  =[ 0 ,   1   ,
1   ,   18  ,
2   ,   243 ,
3   ,   3243240    ,
4   ,   43239   ,
5   ,   574908  ,
6   ,   7618438 ,
7   ,   100803036   ,
8   ,   1332343288  ,
9   ,   17596479795 ,
10  ,   2.32248E+11 ,
11  ,   3.06329E+12 ,
12  ,   4.03744E+13 ,
13  ,   5.31653E+14 ,
14  ,   6.98932E+15 ,
15  ,   9.13651E+16 ,
16  ,   1.1E+18 ,
17  ,   1.2E+19 ,
18  ,   2.9E+19 ,
19  ,   1.5E+18 ,
20  ,   490000000 ]

import matplotlib.pyplot as plt
import numpy as np
plt.plot(np.log( datumCount),'*-' )
plt.xlabel('Distance')
plt.ylabel('Log(number of positions)')
plt.show()

datumCount = datum[1::2]
print( np.array(datumCount[1:])/np.array( datumCount[:-1]) )

array([1.80000000e+01, 1.35000000e+01, 1.33333333e+00,33333333e+01 1.33453704e+02,33453704e+01
       1.32960522e+01, 1.32515776e+01, 1.32314572e+01, 1.32172933e+01,
       1.32071666e+01, 1.31985490e+01, 1.31897368e+01, 1.31800776e+01,
       1.31680718e+01, 1.31463944e+01, 1.30721014e+01, 1.20396081e+01,
       1.09090909e+01, 2.41666667e+00, 5.17241379e-02, 3.26666667e-10])

Log(number of positions)

# Distance      Count of Positions  
datum  =[ 0 ,   1   ,
1   ,   18  ,
2   ,   243 ,
3   ,   324 ,
4   ,   43239   ,
5   ,   574908  ,
6   ,   7618438 ,
7   ,   100803036   ,
8   ,   1332343288  ,
9   ,   17596479795 ,
10  ,   2.32248E+11 ,
11  ,   3.06329E+12 ,
12  ,   4.03744E+13 ,
13  ,   5.31653E+14 ,
14  ,   6.98932E+15 ,
15  ,   9.13651E+16 ,
16  ,   1.1E+18 ,
17  ,   1.2E+19 ,
18  ,   2.9E+19 ,
19  ,   1.5E+18 ,
20  ,   490000000 ]

import matplotlib.pyplot as plt
import numpy as np
plt.plot(np.log( datumCount),'*-' )
plt.xlabel('Distance')
plt.ylabel('Log(number of positions)')
plt.show()

datumCount = datum[1::2]
np.array(datumCount[1:])/np.array( datumCount[:-1])

array([1.80000000e+01, 1.35000000e+01, 1.33333333e+00, 1.33453704e+02,
       1.32960522e+01, 1.32515776e+01, 1.32314572e+01, 1.32172933e+01,
       1.32071666e+01, 1.31985490e+01, 1.31897368e+01, 1.31800776e+01,
       1.31680718e+01, 1.31463944e+01, 1.30721014e+01, 1.20396081e+01,
       1.09090909e+01, 2.41666667e+00, 5.17241379e-02, 3.26666667e-10])

Log(number of positions)

# Distance      Count of Positions  
datum  =[ 0 ,   1   ,
1   ,   18  ,
2   ,   243 ,
3   ,   3240    ,
4   ,   43239   ,
5   ,   574908  ,
6   ,   7618438 ,
7   ,   100803036   ,
8   ,   1332343288  ,
9   ,   17596479795 ,
10  ,   2.32248E+11 ,
11  ,   3.06329E+12 ,
12  ,   4.03744E+13 ,
13  ,   5.31653E+14 ,
14  ,   6.98932E+15 ,
15  ,   9.13651E+16 ,
16  ,   1.1E+18 ,
17  ,   1.2E+19 ,
18  ,   2.9E+19 ,
19  ,   1.5E+18 ,
20  ,   490000000 ]

import matplotlib.pyplot as plt
import numpy as np
plt.plot(np.log( datumCount),'*-' )
plt.xlabel('Distance')
plt.ylabel('Log(number of positions)')
plt.show()

datumCount = datum[1::2]
print( np.array(datumCount[1:])/np.array( datumCount[:-1]) )

[1.80000000e+01 1.35000000e+01 1.33333333e+01 1.33453704e+01
 1.32960522e+01 1.32515776e+01 1.32314572e+01 1.32172933e+01
 1.32071666e+01 1.31985490e+01 1.31897368e+01 1.31800776e+01
 1.31680718e+01 1.31463944e+01 1.30721014e+01 1.20396081e+01
 1.09090909e+01 2.41666667e+00 5.17241379e-02 3.26666667e-10]
added 1 character in body
Source Link
Alexander Chervov
  • 24.9k
  • 20
  • 102
  • 209

Question 2 What are the other examples of groups with similar growth patterpattern ?

Question 2 What are the other examples of groups with similar growth patter ?

Question 2 What are the other examples of groups with similar growth pattern ?

Source Link
Alexander Chervov
  • 24.9k
  • 20
  • 102
  • 209
Loading