fix broken images
Source Link
j.c.
  • 13.6k
  • 3
  • 52
  • 90

It looks like Joseph O'Rourke has beaten me, but I've generated a bit more data than he has:

Let $l$ be the lower bound so that the non-diagonal entries are uniformly distributed between $l$ and 1 and the diagonal entries are distributed between $l+1$ and 2. Note that Piero's original characterization of his code was inaccurate, but I just used his code to generate the figures below.

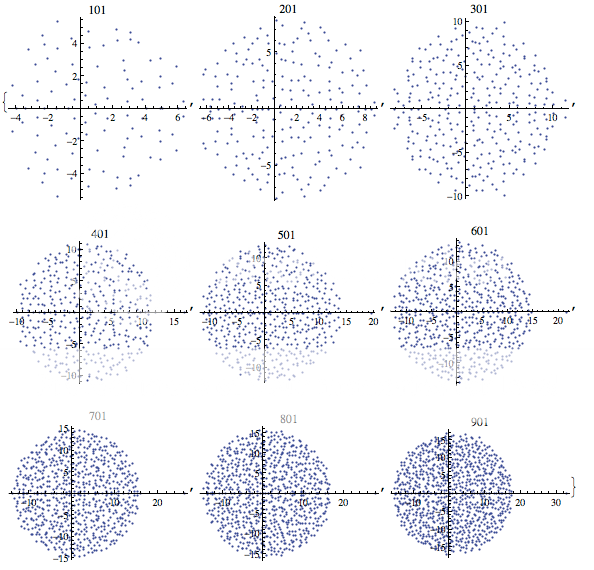
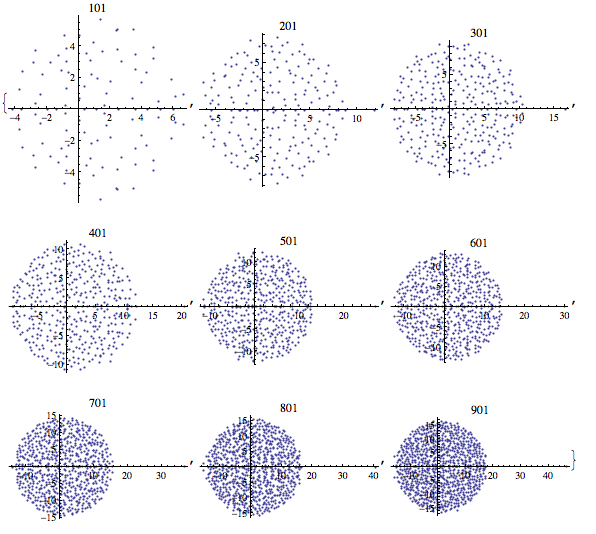
Here is a grid of eigenvalues of such $N$ by $N$ matrices with $l=-.9$ (plots are labeled by $N$):

-.9 plot=.9 plot

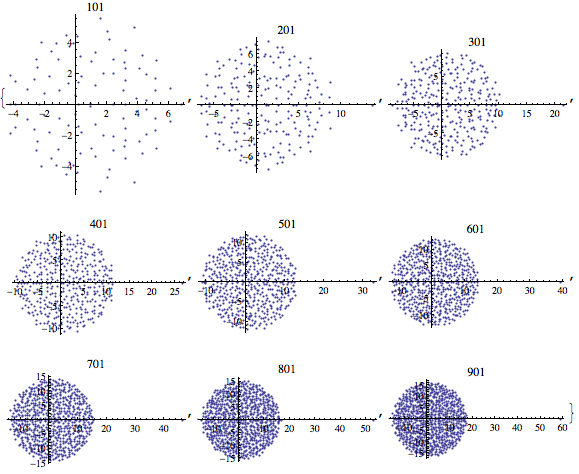
Here's the picture with $l=-.87$:

-.87 plot-.87 plot

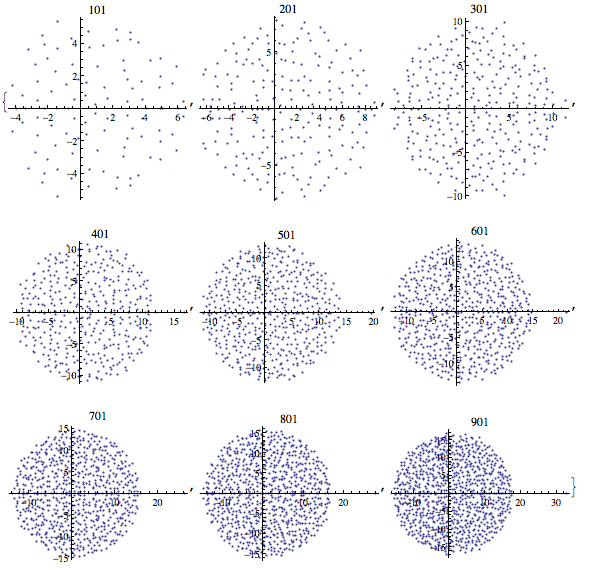
Here's the picture with $l=-.93$:

-.93 plot-.93 plot

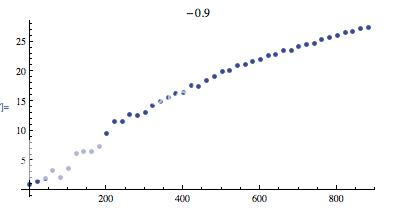
And here's a picture of the absolute value of the largest eigenvalue of the matrix as a function of $N$ (now the label is $l$):

plot of largest eigenvaluesplot of largest eigenvalues

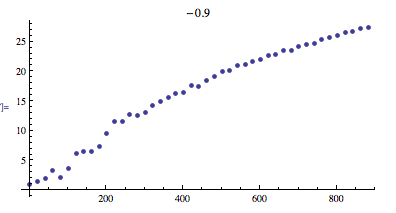
Edit based on Helge's comment: Here's a picture of $\max_{1\leq j \leq N} \sum_{n=1}^{N} u_j^N(n)$ as a function of $N$ (the $u_j^N$ are normalized eigenvectors) with $l=-0.9$:

plot of largest sumplot of largest sum

And here's a picture of the further normalized version $\max_{1\leq j \leq N} \frac{1}{\sqrt{N}}\sum_{n=1}^{N} u_j^N(n)$:

plot of largest sum normalizedplot of largest sum normalized

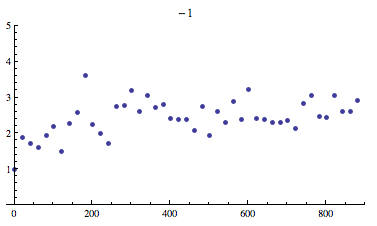
Edit 2: In response to Helge's comment asking for a plot of $\max_{1\leq j \leq N} \sum_{n=1}^{N} u_j^N(n)$ when $l=-1$:

l=-1 plot of largest sum

It looks like Joseph O'Rourke has beaten me, but I've generated a bit more data than he has:

Let $l$ be the lower bound so that the non-diagonal entries are uniformly distributed between $l$ and 1 and the diagonal entries are distributed between $l+1$ and 2. Note that Piero's original characterization of his code was inaccurate, but I just used his code to generate the figures below.

Here is a grid of eigenvalues of such $N$ by $N$ matrices with $l=-.9$ (plots are labeled by $N$)

-.9 plot

Here's the picture with $l=-.87$

-.87 plot

Here's the picture with $l=-.93$

-.93 plot

And here's a picture of the absolute value of the largest eigenvalue of the matrix as a function of $N$ (now the label is $l$)

plot of largest eigenvalues

Edit based on Helge's comment: Here's a picture of $\max_{1\leq j \leq N} \sum_{n=1}^{N} u_j^N(n)$ as a function of $N$ (the $u_j^N$ are normalized eigenvectors) with $l=-0.9$

plot of largest sum

And here's a picture of the further normalized version $\max_{1\leq j \leq N} \frac{1}{\sqrt{N}}\sum_{n=1}^{N} u_j^N(n)$

plot of largest sum normalized

It looks like Joseph O'Rourke has beaten me, but I've generated a bit more data than he has:

Let $l$ be the lower bound so that the non-diagonal entries are uniformly distributed between $l$ and 1 and the diagonal entries are distributed between $l+1$ and 2. Note that Piero's original characterization of his code was inaccurate, but I just used his code to generate the figures below.

Here is a grid of eigenvalues of such $N$ by $N$ matrices with $l=-.9$ (plots are labeled by $N$):

=.9 plot

Here's the picture with $l=-.87$:

-.87 plot

Here's the picture with $l=-.93$:

-.93 plot

And here's a picture of the absolute value of the largest eigenvalue of the matrix as a function of $N$ (now the label is $l$):

plot of largest eigenvalues

Edit based on Helge's comment: Here's a picture of $\max_{1\leq j \leq N} \sum_{n=1}^{N} u_j^N(n)$ as a function of $N$ (the $u_j^N$ are normalized eigenvectors) with $l=-0.9$:

plot of largest sum

And here's a picture of the further normalized version $\max_{1\leq j \leq N} \frac{1}{\sqrt{N}}\sum_{n=1}^{N} u_j^N(n)$:

plot of largest sum normalized

Edit 2: In response to Helge's comment asking for a plot of $\max_{1\leq j \leq N} \sum_{n=1}^{N} u_j^N(n)$ when $l=-1$:
l=-1 plot of largest sum

replaced http://i583.photobucket.com/ with https://i583.photobucket.com/
Source Link

It looks like Joseph O'Rourke has beaten me, but I've generated a bit more data than he has:

Let $l$ be the lower bound so that the non-diagonal entries are uniformly distributed between $l$ and 1 and the diagonal entries are distributed between $l+1$ and 2. Note that Piero's original characterization of his code was inaccurate, but I just used his code to generate the figures below.

Here is a grid of eigenvalues of such $N$ by $N$ matrices with $l=-.9$ (plots are labeled by $N$)

-.9 plot http://i583.photobucket.com/albums/ss275/jaspercrowne/Screenshot2010-07-03at92431AM.png-.9 plot

Here's the picture with $l=-.87$

-.87 plot http://i583.photobucket.com/albums/ss275/jaspercrowne/Screenshot2010-07-03at93508AM.png-.87 plot

Here's the picture with $l=-.93$

-.93 plot http://i583.photobucket.com/albums/ss275/jaspercrowne/Screenshot2010-07-03at92844AM.png-.93 plot

And here's a picture of the absolute value of the largest eigenvalue of the matrix as a function of $N$ (now the label is $l$)

plot of largest eigenvalues http://i583.photobucket.com/albums/ss275/jaspercrowne/Screenshot2010-07-03at95101AM.pngplot of largest eigenvalues

Edit based on Helge's comment: Here's a picture of $\max_{1\leq j \leq N} \sum_{n=1}^{N} u_j^N(n)$ as a function of $N$ (the $u_j^N$ are normalized eigenvectors) with $l=-0.9$

plot of largest sum http://i583.photobucket.com/albums/ss275/jaspercrowne/Screenshot2010-07-03at103302AM.pngplot of largest sum

And here's a picture of the further normalized version $\max_{1\leq j \leq N} \frac{1}{\sqrt{N}}\sum_{n=1}^{N} u_j^N(n)$

plot of largest sum normalized http://i583.photobucket.com/albums/ss275/jaspercrowne/Screenshot2010-07-03at103813AM.pngplot of largest sum normalized

It looks like Joseph O'Rourke has beaten me, but I've generated a bit more data than he has:

Let $l$ be the lower bound so that the non-diagonal entries are uniformly distributed between $l$ and 1 and the diagonal entries are distributed between $l+1$ and 2. Note that Piero's original characterization of his code was inaccurate, but I just used his code to generate the figures below.

Here is a grid of eigenvalues of such $N$ by $N$ matrices with $l=-.9$ (plots are labeled by $N$)

-.9 plot http://i583.photobucket.com/albums/ss275/jaspercrowne/Screenshot2010-07-03at92431AM.png

Here's the picture with $l=-.87$

-.87 plot http://i583.photobucket.com/albums/ss275/jaspercrowne/Screenshot2010-07-03at93508AM.png

Here's the picture with $l=-.93$

-.93 plot http://i583.photobucket.com/albums/ss275/jaspercrowne/Screenshot2010-07-03at92844AM.png

And here's a picture of the absolute value of the largest eigenvalue of the matrix as a function of $N$ (now the label is $l$)

plot of largest eigenvalues http://i583.photobucket.com/albums/ss275/jaspercrowne/Screenshot2010-07-03at95101AM.png

Edit based on Helge's comment: Here's a picture of $\max_{1\leq j \leq N} \sum_{n=1}^{N} u_j^N(n)$ as a function of $N$ (the $u_j^N$ are normalized eigenvectors) with $l=-0.9$

plot of largest sum http://i583.photobucket.com/albums/ss275/jaspercrowne/Screenshot2010-07-03at103302AM.png

And here's a picture of the further normalized version $\max_{1\leq j \leq N} \frac{1}{\sqrt{N}}\sum_{n=1}^{N} u_j^N(n)$

plot of largest sum normalized http://i583.photobucket.com/albums/ss275/jaspercrowne/Screenshot2010-07-03at103813AM.png

It looks like Joseph O'Rourke has beaten me, but I've generated a bit more data than he has:

Let $l$ be the lower bound so that the non-diagonal entries are uniformly distributed between $l$ and 1 and the diagonal entries are distributed between $l+1$ and 2. Note that Piero's original characterization of his code was inaccurate, but I just used his code to generate the figures below.

Here is a grid of eigenvalues of such $N$ by $N$ matrices with $l=-.9$ (plots are labeled by $N$)

-.9 plot

Here's the picture with $l=-.87$

-.87 plot

Here's the picture with $l=-.93$

-.93 plot

And here's a picture of the absolute value of the largest eigenvalue of the matrix as a function of $N$ (now the label is $l$)

plot of largest eigenvalues

Edit based on Helge's comment: Here's a picture of $\max_{1\leq j \leq N} \sum_{n=1}^{N} u_j^N(n)$ as a function of $N$ (the $u_j^N$ are normalized eigenvectors) with $l=-0.9$

plot of largest sum

And here's a picture of the further normalized version $\max_{1\leq j \leq N} \frac{1}{\sqrt{N}}\sum_{n=1}^{N} u_j^N(n)$

plot of largest sum normalized

point out actual matrix ensemble
Source Link
j.c.
  • 13.6k
  • 3
  • 52
  • 90

It looks like Joseph O'Rourke has beaten me, but I've generated a bit more data than he has:

Let $l$ be the lower bound so that according to Piero the non-diagonal entries are uniformly distributed between $l$ and 1 and the diagonal entries are distributed between $l+1$ and 2. Note that Piero's original characterization of his code was inaccurate, but I just used his code to generate the figures below.

Here is a grid of eigenvalues of such $N$ by $N$ matrices with $l=-.9$ (plots are labeled by $N$)

-.9 plot http://i583.photobucket.com/albums/ss275/jaspercrowne/Screenshot2010-07-03at92431AM.png

Here's the picture with $l=-.87$

-.87 plot http://i583.photobucket.com/albums/ss275/jaspercrowne/Screenshot2010-07-03at93508AM.png

Here's the picture with $l=-.93$

-.93 plot http://i583.photobucket.com/albums/ss275/jaspercrowne/Screenshot2010-07-03at92844AM.png

And here's a picture of the absolute value of the largest eigenvalue of the matrix as a function of $N$ (now the label is $l$)

plot of largest eigenvalues http://i583.photobucket.com/albums/ss275/jaspercrowne/Screenshot2010-07-03at95101AM.png

Edit based on Helge's comment: Here's a picture of $\max_{1\leq j \leq N} \sum_{n=1}^{N} u_j^N(n)$ as a function of $N$ (the $u_j^N$ are normalized eigenvectors) with $l=-0.9$

plot of largest sum http://i583.photobucket.com/albums/ss275/jaspercrowne/Screenshot2010-07-03at103302AM.png

And here's a picture of the further normalized version $\max_{1\leq j \leq N} \frac{1}{\sqrt{N}}\sum_{n=1}^{N} u_j^N(n)$

plot of largest sum normalized http://i583.photobucket.com/albums/ss275/jaspercrowne/Screenshot2010-07-03at103813AM.png

It looks like Joseph O'Rourke has beaten me, but I've generated a bit more data than he has:

Let $l$ be the lower bound so that according to Piero the entries are uniformly distributed between $l$ and 1.

Here is a grid of eigenvalues of $N$ by $N$ matrices with $l=-.9$ (plots are labeled by $N$)

-.9 plot http://i583.photobucket.com/albums/ss275/jaspercrowne/Screenshot2010-07-03at92431AM.png

Here's the picture with $l=-.87$

-.87 plot http://i583.photobucket.com/albums/ss275/jaspercrowne/Screenshot2010-07-03at93508AM.png

Here's the picture with $l=-.93$

-.93 plot http://i583.photobucket.com/albums/ss275/jaspercrowne/Screenshot2010-07-03at92844AM.png

And here's a picture of the absolute value of the largest eigenvalue of the matrix as a function of $N$ (now the label is $l$)

plot of largest eigenvalues http://i583.photobucket.com/albums/ss275/jaspercrowne/Screenshot2010-07-03at95101AM.png

Edit based on Helge's comment: Here's a picture of $\max_{1\leq j \leq N} \sum_{n=1}^{N} u_j^N(n)$ as a function of $N$ (the $u_j^N$ are normalized eigenvectors) with $l=-0.9$

plot of largest sum http://i583.photobucket.com/albums/ss275/jaspercrowne/Screenshot2010-07-03at103302AM.png

And here's a picture of the further normalized version $\max_{1\leq j \leq N} \frac{1}{\sqrt{N}}\sum_{n=1}^{N} u_j^N(n)$

plot of largest sum normalized http://i583.photobucket.com/albums/ss275/jaspercrowne/Screenshot2010-07-03at103813AM.png

It looks like Joseph O'Rourke has beaten me, but I've generated a bit more data than he has:

Let $l$ be the lower bound so that the non-diagonal entries are uniformly distributed between $l$ and 1 and the diagonal entries are distributed between $l+1$ and 2. Note that Piero's original characterization of his code was inaccurate, but I just used his code to generate the figures below.

Here is a grid of eigenvalues of such $N$ by $N$ matrices with $l=-.9$ (plots are labeled by $N$)

-.9 plot http://i583.photobucket.com/albums/ss275/jaspercrowne/Screenshot2010-07-03at92431AM.png

Here's the picture with $l=-.87$

-.87 plot http://i583.photobucket.com/albums/ss275/jaspercrowne/Screenshot2010-07-03at93508AM.png

Here's the picture with $l=-.93$

-.93 plot http://i583.photobucket.com/albums/ss275/jaspercrowne/Screenshot2010-07-03at92844AM.png

And here's a picture of the absolute value of the largest eigenvalue of the matrix as a function of $N$ (now the label is $l$)

plot of largest eigenvalues http://i583.photobucket.com/albums/ss275/jaspercrowne/Screenshot2010-07-03at95101AM.png

Edit based on Helge's comment: Here's a picture of $\max_{1\leq j \leq N} \sum_{n=1}^{N} u_j^N(n)$ as a function of $N$ (the $u_j^N$ are normalized eigenvectors) with $l=-0.9$

plot of largest sum http://i583.photobucket.com/albums/ss275/jaspercrowne/Screenshot2010-07-03at103302AM.png

And here's a picture of the further normalized version $\max_{1\leq j \leq N} \frac{1}{\sqrt{N}}\sum_{n=1}^{N} u_j^N(n)$

plot of largest sum normalized http://i583.photobucket.com/albums/ss275/jaspercrowne/Screenshot2010-07-03at103813AM.png

more plots
Source Link
j.c.
  • 13.6k
  • 3
  • 52
  • 90
Loading
Source Link
j.c.
  • 13.6k
  • 3
  • 52
  • 90
Loading