changed last plot to a more tractable one
Source Link

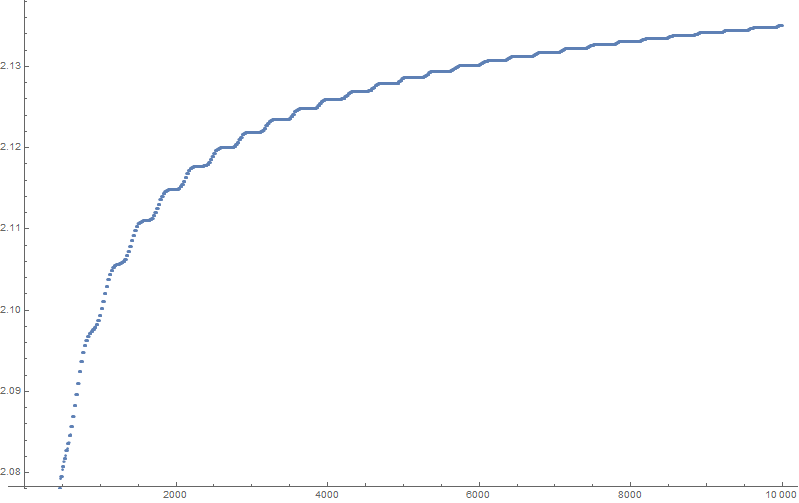
On the OP request, here is the plot of first 10000 partial sums.

enter image description here

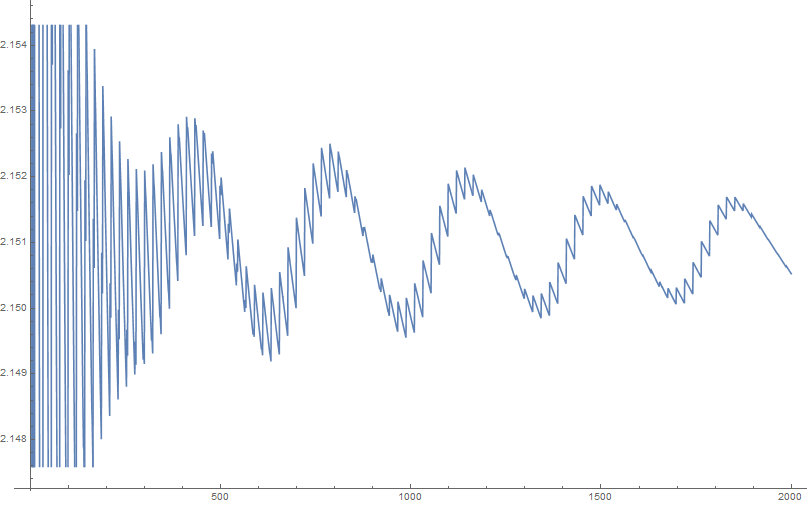
Following Terry Tao's suggestion, here is the plot of ($n$th partial sum) $+2^{\frac32}/\sqrt{\pi n}$ for $n$ up to one million:

enter image description here

The thick line in the beginning actually consists of high frequency oscillations - in the range up to 2000 it looks like this:

enter image description here

(I hope there are no rounding artifacts, I calculated everything with 100 decimal digits precision)

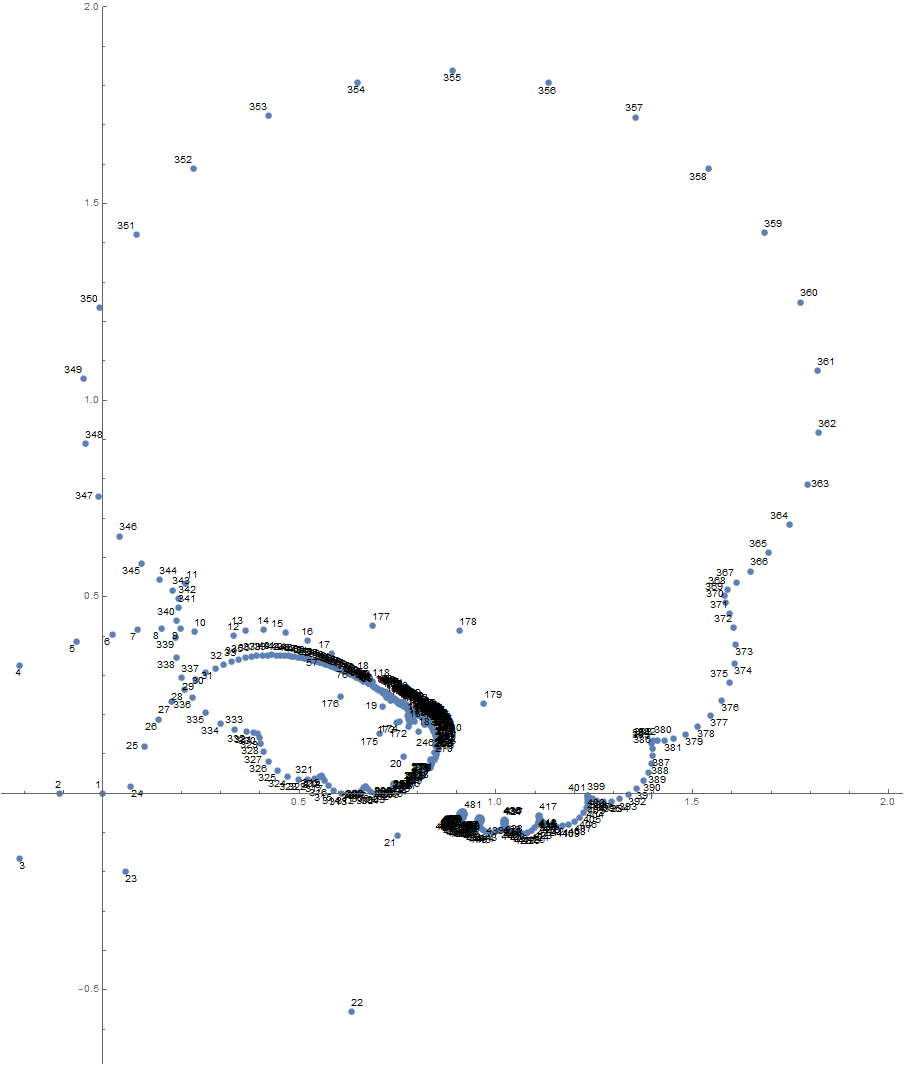
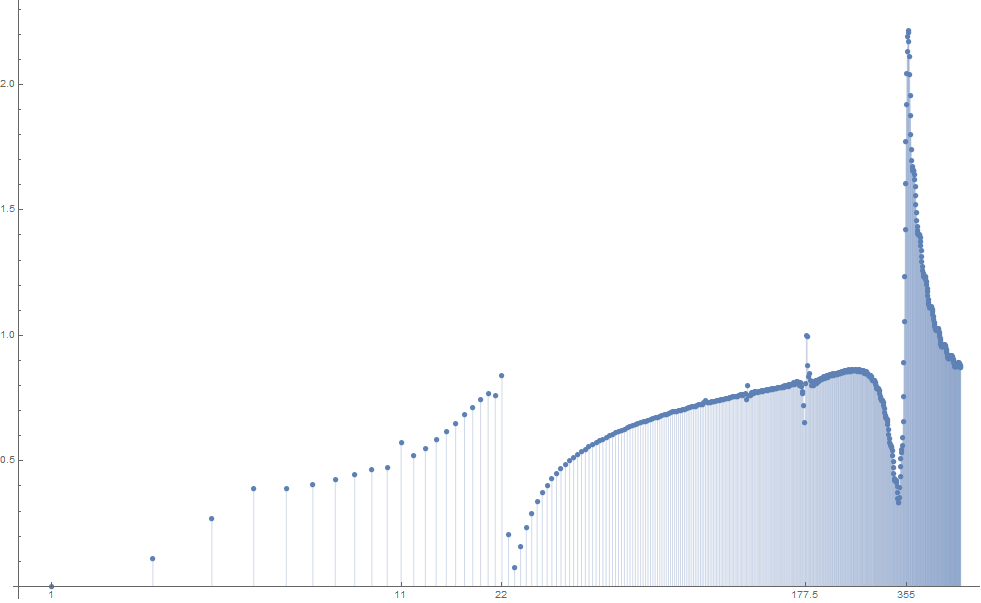
Next, following suggestion by j.c. in a comment below, I tried to plot the (discrete) Fourier transform of the first 10000 points; the result is this:

enter image description hereenter image description here

More precisely, coordinates ofheight at the point labeledwith abscissa $n$ areis the real and imaginary partabsolute value of the scalar product of the vector of first 10000 partial sums minus its average with the vector $\left(e^{\frac{2\pi i k}n}\right)_{1\le k\le 10000}$.

You see that $22$ and $355$, as well as $177,178=\frac{355}2\pm\frac12$ are all clearly visible. $11$ ($=\frac{22}2$) is also near a local peak, it just got too close to $343$and $177.5=\frac{355}2$ are all clearly visible.

If I will have more time I will try to do the same with more data, to detect $52163$ mentioned by Terry Tao in a previous comment. I am not sure about the arbitrary phase shift that I introduced, though - I could start with $k=0$ instead of $k=1$, or any other $k$.

On the OP request, here is the plot of first 10000 partial sums.

enter image description here

Following Terry Tao's suggestion, here is the plot of ($n$th partial sum) $+2^{\frac32}/\sqrt{\pi n}$ for $n$ up to one million:

enter image description here

The thick line in the beginning actually consists of high frequency oscillations - in the range up to 2000 it looks like this:

enter image description here

(I hope there are no rounding artifacts, I calculated everything with 100 decimal digits precision)

Next, following suggestion by j.c. in a comment below, I tried to plot the (discrete) Fourier transform of the first 10000 points; the result is this:

enter image description here

More precisely, coordinates of the point labeled $n$ are the real and imaginary part of the scalar product of the vector of first 10000 partial sums minus its average with the vector $\left(e^{\frac{2\pi i k}n}\right)_{1\le k\le 10000}$.

You see that $22$ and $355$, as well as $177,178=\frac{355}2\pm\frac12$ are all clearly visible. $11$ ($=\frac{22}2$) is also near a local peak, it just got too close to $343$.

If I will have more time I will try to do the same with more data, to detect $52163$ mentioned by Terry Tao in a previous comment. I am not sure about the arbitrary phase shift that I introduced, though - I could start with $k=0$ instead of $k=1$, or any other $k$.

On the OP request, here is the plot of first 10000 partial sums.

enter image description here

Following Terry Tao's suggestion, here is the plot of ($n$th partial sum) $+2^{\frac32}/\sqrt{\pi n}$ for $n$ up to one million:

enter image description here

The thick line in the beginning actually consists of high frequency oscillations - in the range up to 2000 it looks like this:

enter image description here

(I hope there are no rounding artifacts, I calculated everything with 100 decimal digits precision)

Next, following suggestion by j.c. in a comment below, I tried to plot the (discrete) Fourier transform of the first 10000 points; the result is this:

enter image description here

More precisely, height at the point with abscissa $n$ is the absolute value of the scalar product of the vector of first 10000 partial sums minus its average with the vector $\left(e^{\frac{2\pi i k}n}\right)_{1\le k\le 10000}$.

You see that $22$ and $355$, as well as $11$ ($=\frac{22}2$) and $177.5=\frac{355}2$ are all clearly visible.

If I will have more time I will try to do the same with more data, to detect $52163$ mentioned by Terry Tao in a previous comment. I am not sure about the arbitrary phase shift that I introduced, though - I could start with $k=0$ instead of $k=1$, or any other $k$.
added 83 characters in body
Source Link

On the OP request, here is the plot of first 10000 partial sums.

enter image description here

Following Terry Tao's suggestion, here is the plot of ($n$th partial sum) $+2^{\frac32}/\sqrt{\pi n}$ for $n$ up to one million:

enter image description here

The thick line in the beginning actually consists of high frequency oscillations - in the range up to 2000 it looks like this:

enter image description here

(I hope there are no rounding artifacts, I calculated everything with 100 decimal digits precision)

Next, following suggestion by j.c. in a comment below, I tried to plot the (discrete) Fourier transform of the first 10000 points; the result is this:

enter image description here

More precisely, coordinates of the point labeled $n$ are the real and imaginary part of the scalar product of the vector of first 10000 partial sums minus its average with the vector $\left(e^{\frac{2\pi i k}n}\right)_{1\le k\le 10000}$.

You see that $22$ and $355$, as well as $177,178=\frac{355}2\pm\frac12$ are all clearly visible. $11$ ($=\frac{22}2$) is also near a local peak, it just got too close to $343$.

If I will have more time I will try to do the same with more data, to detect $52163$ mentioned by Terry Tao in a previous comment. I am not sure about the arbitrary phase shift that I introduced, though - I could start with $k=0$ instead of $k=1$, or any other $k$.
On the OP request, here is the plot of first 10000 partial sums.

enter image description here

Following Terry Tao's suggestion, here is the plot of ($n$th partial sum) $+2^{\frac32}/\sqrt{\pi n}$ for $n$ up to one million:

enter image description here

The thick line in the beginning actually consists of high frequency oscillations - in the range up to 2000 it looks like this:

enter image description here

(I hope there are no rounding artifacts, I calculated everything with 100 decimal digits precision)

Next, following suggestion by j.c. in a comment below, I tried to plot the (discrete) Fourier transform of the first 10000 points; the result is this:

enter image description here

More precisely, coordinates of the point labeled $n$ are the real and imaginary part of the scalar product of the vector of first 10000 partial sums minus its average with the vector $\left(e^{\frac{2\pi i k}n}\right)_{1\le k\le 10000}$.

You see that $22$ and $355$, as well as $177,178=\frac{355}2\pm\frac12$ are all clearly visible. If I will have more time I will try to do the same with more data, to detect $52163$ mentioned by Terry Tao in a previous comment. I am not sure about the arbitrary phase shift that I introduced, though - I could start with $k=0$ instead of $k=1$, or any other $k$.
On the OP request, here is the plot of first 10000 partial sums.

enter image description here

Following Terry Tao's suggestion, here is the plot of ($n$th partial sum) $+2^{\frac32}/\sqrt{\pi n}$ for $n$ up to one million:

enter image description here

The thick line in the beginning actually consists of high frequency oscillations - in the range up to 2000 it looks like this:

enter image description here

(I hope there are no rounding artifacts, I calculated everything with 100 decimal digits precision)

Next, following suggestion by j.c. in a comment below, I tried to plot the (discrete) Fourier transform of the first 10000 points; the result is this:

enter image description here

More precisely, coordinates of the point labeled $n$ are the real and imaginary part of the scalar product of the vector of first 10000 partial sums minus its average with the vector $\left(e^{\frac{2\pi i k}n}\right)_{1\le k\le 10000}$.

You see that $22$ and $355$, as well as $177,178=\frac{355}2\pm\frac12$ are all clearly visible. $11$ ($=\frac{22}2$) is also near a local peak, it just got too close to $343$.

If I will have more time I will try to do the same with more data, to detect $52163$ mentioned by Terry Tao in a previous comment. I am not sure about the arbitrary phase shift that I introduced, though - I could start with $k=0$ instead of $k=1$, or any other $k$.

added one more plot
Source Link

On the OP request, here is the plot of first 10000 partial sums.

enter image description here

Following Terry Tao's suggestion, here is the plot of ($n$th partial sum) $+2^{\frac32}/\sqrt{\pi n}$ for $n$ up to one million:

enter image description here

The thick line in the beginning actually consists of high frequency oscillations - in the range up to 2000 it looks like this:

enter image description here

(I hope there are no rounding artifacts, I calculated everything with 100 decimal digits precision)

Next, following suggestion by j.c. in a comment below, I tried to plot the (discrete) Fourier transform of the first 10000 points; the result is this:

enter image description here

More precisely, coordinates of the point labeled $n$ are the real and imaginary part of the scalar product of the vector of first 10000 partial sums minus its average with the vector $\left(e^{\frac{2\pi i k}n}\right)_{1\le k\le 10000}$.

You see that $22$ and $355$, as well as $177,178=\frac{355}2\pm\frac12$ are all clearly visible. If I will have more time I will try to do the same with more data, to detect $52163$ mentioned by Terry Tao in a previous comment. I am not sure about the arbitrary phase shift that I introduced, though - I could start with $k=0$ instead of $k=1$, or any other $k$.

On the OP request, here is the plot of first 10000 partial sums.

enter image description here

Following Terry Tao's suggestion, here is the plot of ($n$th partial sum) $+2^{\frac32}/\sqrt{\pi n}$ for $n$ up to one million:

enter image description here

The thick line in the beginning actually consists of high frequency oscillations - in the range up to 2000 it looks like this:

enter image description here

(I hope there are no rounding artifacts, I calculated everything with 100 decimal digits precision)

Next, following suggestion by j.c. in a comment below, I tried to plot the (discrete) Fourier transform of the first 10000 points; the result is this:

enter image description here

More precisely, coordinates of the point labeled $n$ are the real and imaginary part of the scalar product of the vector of first 10000 partial sums minus its average with the vector $\left(e^{\frac{2\pi i k}n}\right)_{1\le k\le 10000}$.

You see that $22$ and $355$, as well as $177,178=\frac{355}2\pm\frac12$ are all clearly visible. If I will have more time I will try to do the same with more data, to detect $52163$ mentioned by Terry Tao in a previous comment. I am not sure about the arbitrary phase shift that I introduced, though - I could start with $k=0$ instead of $k=1$, or any other $k$.

added plots
Source Link
Loading
Post Made Community Wiki
Source Link
Loading