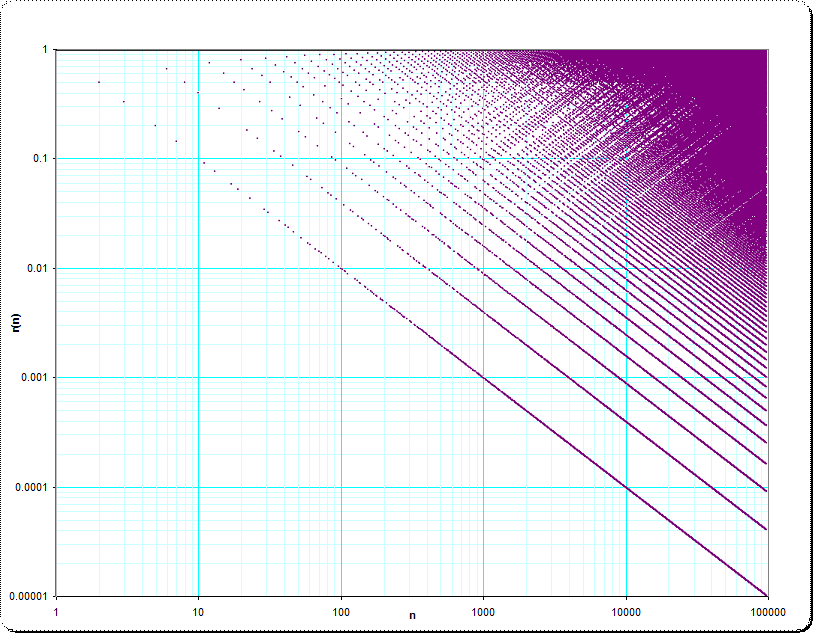
Just an additional comment: because it was discussed, whether the structures shall be visible when n increases, I've thought, it would possibly be interesting to rescale the axes. One additional plot, the original values recomputed, but $n$- and $r(n$)-axes logarithmically scaled for display gives this image:
$\qquad \qquad $ ($ \small n \to \ln_{10}(n) $$ \small n \to \log_{10}(n) $ , $ \small r(n) \to \ln_{10}(r(n)) $$ \small r(n) \to \log_{10}(r(n)) $ where $ \small n=1 \ldots 100 000$, $ \small 0 \lt r(n) \le 1$)


